Off The Charts: An Interview with John Foreman, Chief Data Scientist at MailChimp
Posted by melissa on February 7, 2014 Off The Charts
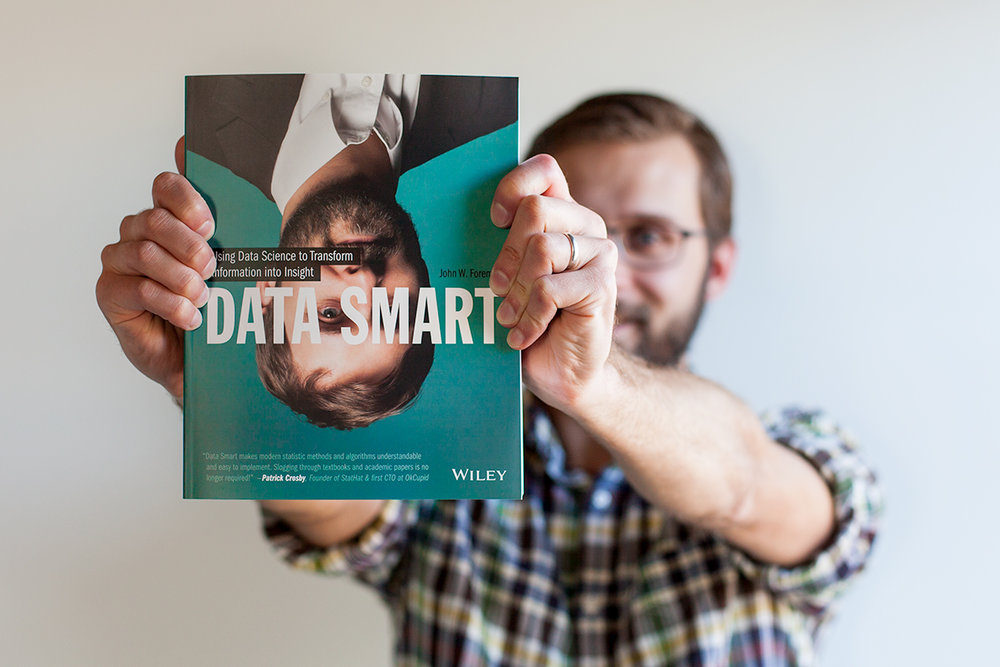
As a MailChimp customer and fan, it’s wonderful to have John Foreman, chief data scientist at MailChimp, as part of our “Off the Charts” interview series. If you are going to Starta next week, check out his talk, Dissecting Data Science Algorithms using Spreadsheets, and/or follow him on Twitter for more insights.
You recently wrote a book, Data Smart: Using Data Science to Transform Information into Insight. We love the concept of teaching everyday people how to do data science, tell us more about your book?
Before I was a data scientist at MailChimp, I was for many years an analytics consultant to large enterprises. I got to work on some really awesome problems. Now, this was prior to the heady days of big data and data science. So once I entered the data science world, I quickly realized that those I’d left behind in the enterprise space didn’t speak the same language as those in the data science world.
Specifically, Excel, SAS, Teradata, and Oracle seem to rule the enterprise where terms like “business intelligence” are bandied about, whereas R, Python, and Hadoop have a better hold in companies talking data science.
So I asked myself, how would I teach the important techniques of the data science world to folks in the enterprise world? And by teach, I mean really dig into the algorithms. It’s hard to teach machine learning and data mining in R where most tutorials seem to start with “now load the relevant library that’s done all the work for you.”
I decided to teach data science in spreadsheets. There are no libraries to help you. There is no code. There are just numbers and formulas, which is awesome for learning and terrible for production. So in the book, I teach readers the algorithms in great detail. Then at the end of the book, I gently usher the reader into R once I know that everyone has a rock-solid understanding of the techniques.
So I asked myself, how would I teach the important techniques of the data science world to folks in the enterprise world? … I decided to teach data science in spreadsheets.
We think data literacy is the new computer literacy, meaning we think businesses will eventually come to expect all employees to understand how to represent data and do some sort of analysis. What do you think?
Couldn’t agree more. Everyone should be able to write spaghetti code, and everyone should be able to pull and analyze data. And I’m not just talking about business-folk here.
Everyone should feel the power of writing a terrible data-munging prototype script at some point.
Look at what’s going on in the digital humanities. Now, even literature, history, and religious scholars can use data to shed new insight on old texts. How awesome is that? But you have to be able to actually analyze the data. That means being able to query and scrub; that means knowing a bit of probability and statistics. The difference between a median and mean would be a start.
So yes, it’s no longer acceptable to say, “I suck at math!” and then ignore that part of the world.
I suck at physical exercise, but that doesn’t mean it’s OK for me to melt into a chair all day. We all need to work at the important stuff in life, and understanding data has become terribly important.
Tell us how you got interested and started practicing data science?
I’ve been practicing data science for years; it was just called analytics or operations research.
I started as a pure math guy. I loved abstract algebra. But I decided to try something a little more applied, so I worked for a professor studying the mathematics of knot-tying which has applications in protein folding and physical cosmology. This was my first taste of writing awful C code and hunting for memory leaks with valgrind.
I ended up at the NSA and then Booz Allen doing large analytics projects for the government. Awesome math, not so awesome clients, so I left the government to consult for large enterprises like Coca-Cola, building supply and revenue optimization models. I believe that the revenue optimization models that companies like Intercontinental Hotels and Royal Caribbean have been building in the enterprise world are great examples of data science before there was data science.
From there, MailChimp seems like a strange jump. Fortune 500s to a start-up culture.
But for however much data most old-guard Fortune 500s have, MailChimp has more. MailChimp sends four hundred million emails a day for customers all across the globe, and we track engagement (opens, clicks, unsubscribes, abuse reports, Google analytics data, e-commerce data, custom triggered events, etc.) on those newsletters to the tune of another hundred million events a day. And that’s just the beginning.
That type of activity puts MailChimp on the Alexa 500. Twice.
So I traded in my Oracle and SAS chops for Postgres, R, and Redis, and the rest has been a blast.
When you aren’t writing books, you are Chief Data Scientist at MailChimp. What is the overall goal for the data science team at MailChimp?
For the MailChimp data science team, we endeavor to move beyond the aggregate. Too often companies stop at pulling aggregate stats via hadoop and call it a day. Or maybe they’ll release an infographic of their aggregate data to prove to their investors that their big data investment was worth it. That’s great, but it’s not enough to give a company a competitive edge.
Yes we provide summary data in reports and blog posts to our internal and external customers. But our real passion lies in building data products. We use machine learning, optimization modeling, forecasting, etc. to build tools that improve MailChimp as an application and help other teams and our customers do their work better. That should always be the goal of a good data science team – leading from the back, giving people the data-driven insight they need to do their work better.
That should always be the goal of a good data science team – leading from the back, giving people the data-driven insight they need to do their work better.
What types of data do you track?
MailChimp sends email, so to start at the top, we save all the content our users send through us. We also have all of the user’s account meta-data. But let’s move to the individual address level, because that’s where things get interesting. MailChimp sends email to billions of unique email addresses all across the world. So we have all of an email address’s subscriptions, which is a great vector when trying to understand interest and demographic data. The typical fantasy football newsletter subscriber is very different from the typical quilting newsletter subscriber.
Then there’s email engagement data – emails sent through us generally have open tracking and click tracking turned on. So we get sends, opens, and clicks at an individual level. We also get unsubscribes and abuse reports. With engagement comes geolocation and device preference, so we know whether the reader is on a mobile device for instance.
But the engagement data goes beyond clicking. Those MailChimp users who choose to can use MailChimp’s Goal feature to track subscribers once they go to the sender’s site from an email campaign. You can track abandoned shopping carts, purchases, etc. once the readers click through. These interactions power better segmentation and reporting for the user.
All of this data goes into building products that allow our users to better understand and speak to their audiences. This is handy for publishers, nonprofits, and small businesses alike. The more you can understand what your readership is interested in, the better you can engage them rather than just “blasting” at them as email marketers did years ago.
What types of metrics do you track at MailChimp?
We track a lot of data to verify our models are working. For instance, we have a model called Omnivore that shuts down bad users while letting good users sail through. We track metrics around abuse to make sure it’s working and not in need of retraining.
But at a high level, we try to avoid tracking a lot of ugly metrics like ARPU We’ve seen from our competitors that when you track these company-level revenue metrics, you start trying to do good by the metric rather than by your customers. And that’s when things get perverse. That’s when you get internal politics and people playing games with the numbers to further their own careers. So when it comes to things like the ROI of a billboard campaign, you can count on me to fight against my need to measure everything.
Are there any cool trends you have discovered - like times you should send out a newsletter, when people open the most newsletters, etc.
We’ve discovered all sorts of cool stuff! Regarding the optimal send time, we discovered that that’s a myth. Humans are complex and their schedules are complex, so the best time to engage them depends on the sender and their content as well as on the reader. That’s why we built Send Time Optimization. Rather than assume that all senders and subscribers are the same, the model uses data (what a novel idea!) to figure out when your readership will most likely engage with your content.
Regarding the optimal send time, we discovered that that’s a myth.
I recently discussed in a post on the MailChimp blog the age and browser preference of email addresses from the big free email providers. I’m sure it comes as no surprise that Gmail users are about a decade younger than AOL users. For both email providers though, the number one way the readers view email is on the iPhone (for AOL, the AOL Explorer browser still plays a role which is frightening). Also, Gmail email addresses are disproportionately interested in software/apps newsletters, while AOL addresses seem to prefer reading about politics. Go figure.
What types of data tools do you use at MailChimp?
R and Python are big tools for us. We also do a lot data pulling and manipulation via SQL and some in-house, custom map-reduce tools. But more than any of these, oddly enough, I’d say we spend a huge chunk of our time pushing around data in the command line. I’ve been putting in a lot more time this year using awk and sed than I ever would have thought! That’s one set of skills every data scientist should have – a great knowledge of how to work with files from the command line. Why write a python script to do something when a few pipes in bash will do the job in 10 seconds?
For those looking to get more involved with data science, where do you recommend he/she start?
I’m a big fan of reading books. Seriously. They’re often better at preparing individuals for a role than a bunch of bookmarked blog posts. And I say that as a guy who writes a blog.
My book would be a great start! But there are actually a number of excellent books out there. Max Kuhn’s new Springer book is excellent for those who want a little more depth. Or go “full Hastie” if you like.
The data science community is really active online and generally friendly. Engage with others on sites like DataTau and Cross Validated, not to mention Twitter. Data science folks seem to like Twitter…must be all that streaming, unstructured text.
Related Content
-

Startups, Data and Fundraising - an Interview with Amanda Kattan
Amanda Kattan data and finance consultant -
Data for Good with Aziz Alghunaim, Co-founder and CTO of Tarjimly
Aziz Alghunaim Co-founder and CTO Tarjimly -

An Interview with Daniel Mill of The New York Times
Daniel Mill Director of Marketing Analytics The New York Times