Off the Charts: An Interview with Ri Liu - Design Technologist
Posted by natasha on April 29, 2014 Off The Charts
I came across Ri Liu’s visualizationon gender disparity within engineering teams and I knew immediately that I wanted to interview her for our Off the Charts series. Ri is the creator of the Web Colour Data tool, that visualizes the colour scheme for any website which has been featured on popular blogs and Wired UK magazine. She has worked on projects for Google, Facebook, The Nation, Popular Science, La Panacee, Pew Charitable Trusts and the UC Davis Phinch project.
Can you tell us a bit about yourself? What drew you into the field of data visualization?
I’m originally from Australia and spent 2 years in Chicago before moving to San Francisco. I went for bachelor degrees in both Interaction Design and Information Technology because I couldn’t decide whether to do something creative or technical. I’ve spent most of my career avoiding that decision and it’s worked out fairly well.
To me, data visualisation is the perfect blend of the analytical and the beautiful, a great example of where both form and function are vital. The thing I love the most about working in the field is the ability to make data accessible. Most people will have their eyes glaze over when exposed to rows and rows of data in a spreadsheet, but when data visualisation is done well, the richness of the information makes it inviting.
Most people will have their eyes glaze over when exposed to rows and rows of data in a spreadsheet, but when data visualisation is done well, the richness of the information makes it inviting.
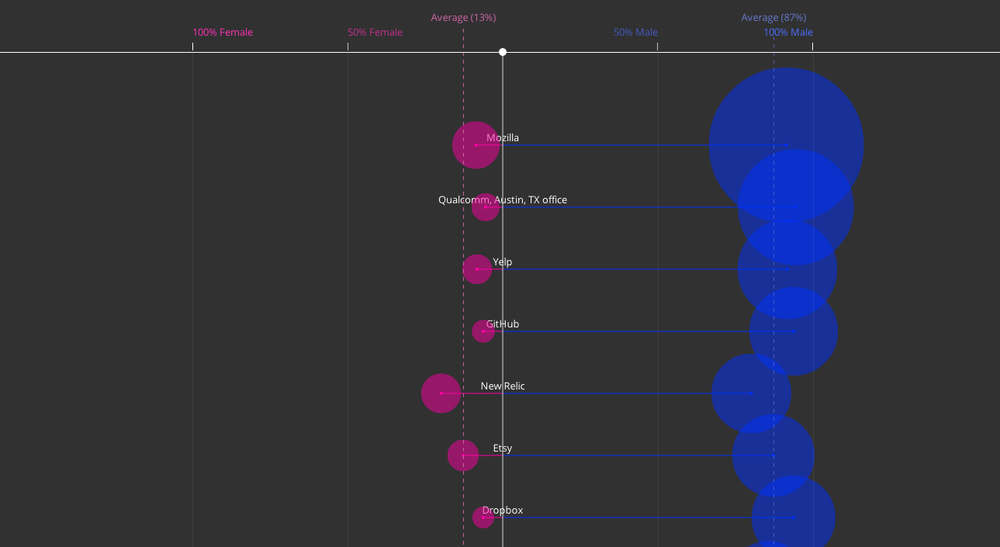
I really enjoyed the data visualization you created of gender disparity within engineering teams. Can you tell us more about this project and what inspired you to create it?
There has been a lot of ongoing debate and drama in the tech industry over gender issues. I hope that we have moved on from discussing whether or not it is beneficial to have more women in technical teams (if not, there’s a ton of research on the subject), but what we have been lacking are the numbers to strengthen the case. It is actually quite difficult to convince tech companies to publicize these numbers, so Tracy Chou, an engineer at Pinterest, started gathering data on this spreadsheet.

I had been aware of this dataset for a while and as I was getting pretty frustrated with all the issues going on, I decided that I needed to do something with it. I wanted to use my skills in data visualization to allow people to see what the disparity actually looks like between genders in engineering teams. The goal was to have something compelling that people can point to when questions such as ‘is this really a problem?’ pop up.
Can you tell us more about Pitch Interactive and their approach to data?
Pitch Interactive is a data visualisation studio, currently based in Berkeley. We create a variety of work from web pieces on drone strikes, magazine spreads on 311 calls in NYC, to interactive installations. We’ll rarely say no to an interesting project that is new territory since a lot of the work we do is new territory. The only requirement is that it needs to be built on data.
We’re not a huge fan of titles at Pitch, since we’re such an interdisciplinary team. There’s no one person who just codes, or just designs. We all code. Being able to dig into the data with code lets you get intimate with it, which makes you ask more questions, which triggers more ideas. We will usually start this way, by looking at the data to see what stories it tells us. In the early stages it can look fairly boring visually. We generate bar charts and line graphs, which help us identify the story. When we have the story and insights we can start to think about more creative ways of presenting this visually.
Being able to dig into the data with code lets you get intimate with it, which makes you ask more questions, which triggers more ideas.
What are some of your favorite projects that you’ve contributed to at Pitch Interactive?
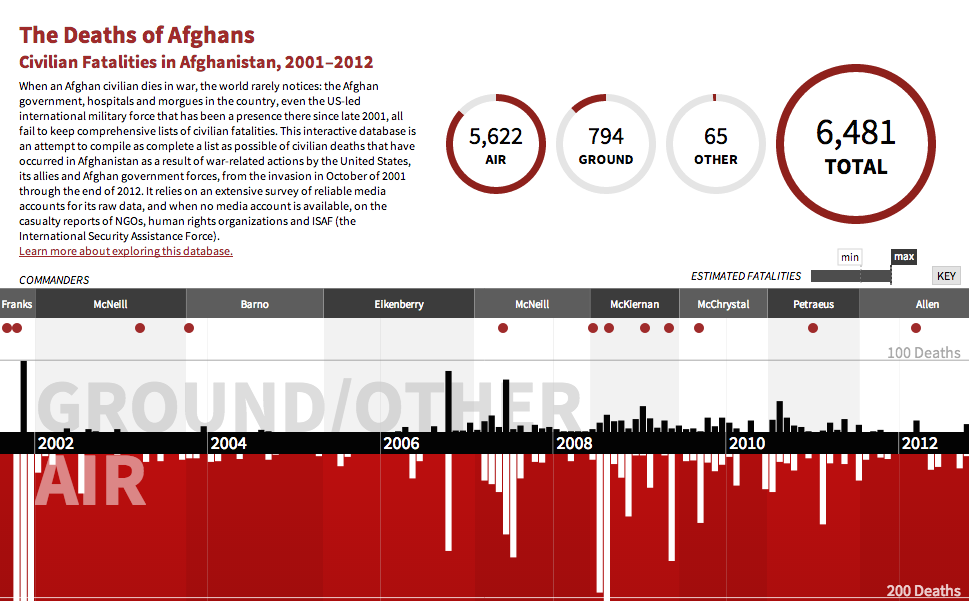
One of the first projects I worked on when I started at Pitch was a piece on deaths in Afghanistan for The Nation. This was some heavy subject matter, but it definitely opened my eyes to some things that are happening in the world.

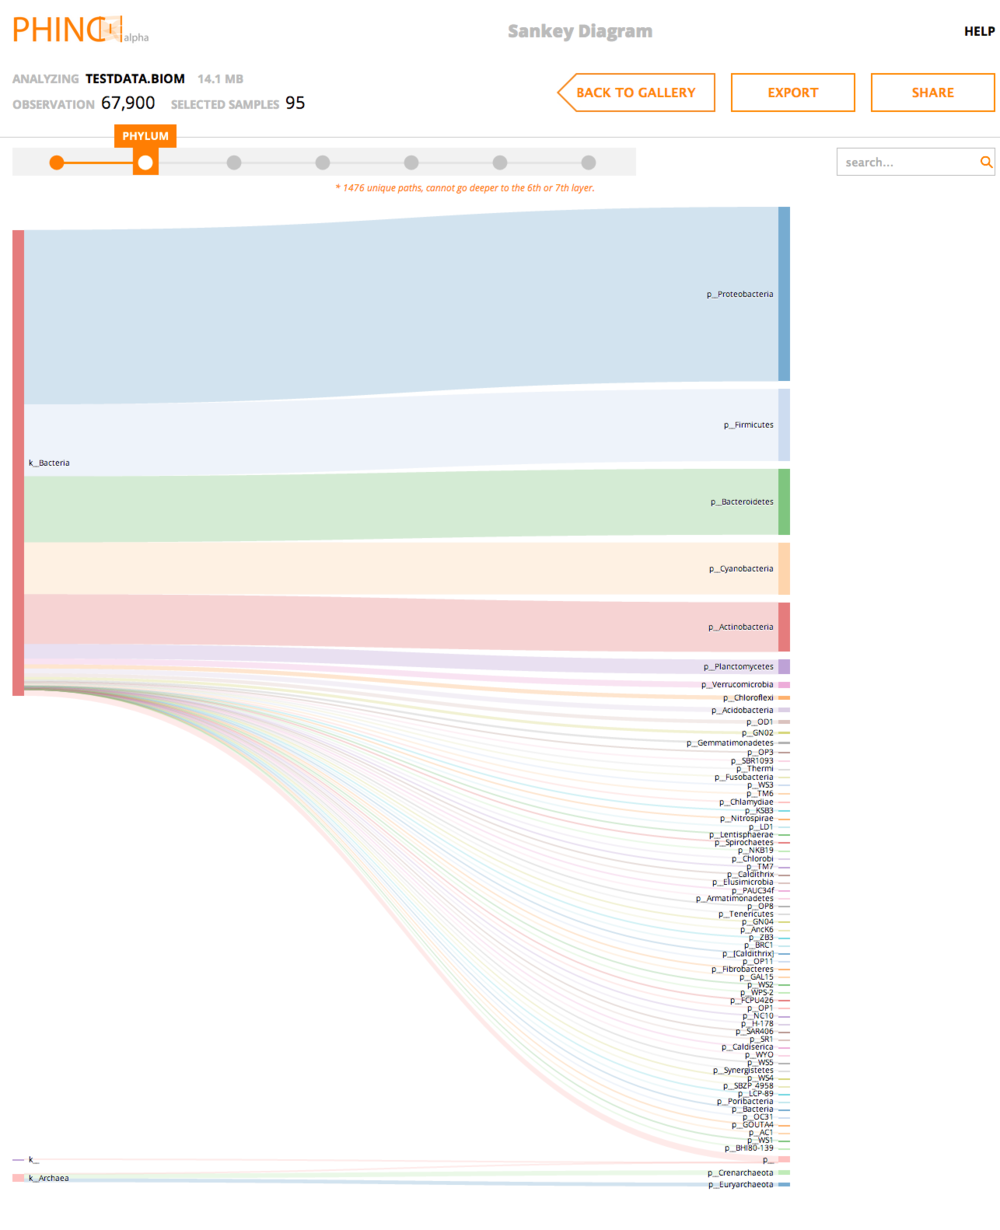
I’ve also been designing for a project we’re working on in partnership with UC Davis, which is a tool for scientists to visualise biological data (e.g. data on genetics, proteins and microbial species). I’ve been lucky to work on some pretty cool stuff at Pitch including a piece on the city of Montpellier in France for a museum exhibit and some work for Facebook and Google.

How did you start doing data-driven work, and what do you enjoy about it?
I’ve always been a bit of a data nerd. My father is a database warehouse engineer, it was one of my favourite subjects at university and I went on to teach some SQL too. It is hard to argue against someone when they have data on their side. This is often a nice break from the design world where a lot of what constitutes ‘good design’ is based on taste and subjective opinions. You can also discover new things just by looking at a particular set of data in a different way. There is a lot of discovery going on when you work with data, it can be a bit of a rabbit hole.
It is hard to argue against someone when they have data on their side.
What are your go-to tools for your work?
I jump around a lot between using code to more traditional design tools like Illustrator and Photoshop. When I’m coding I will usually use D3 or Processing or block things out in HTML/CSS. Besides that it would be the old fashioned pen and paper. I’m not dogmatic about specific design tools. Whatever is the least limiting way to get ideas out from your brain usually works best.
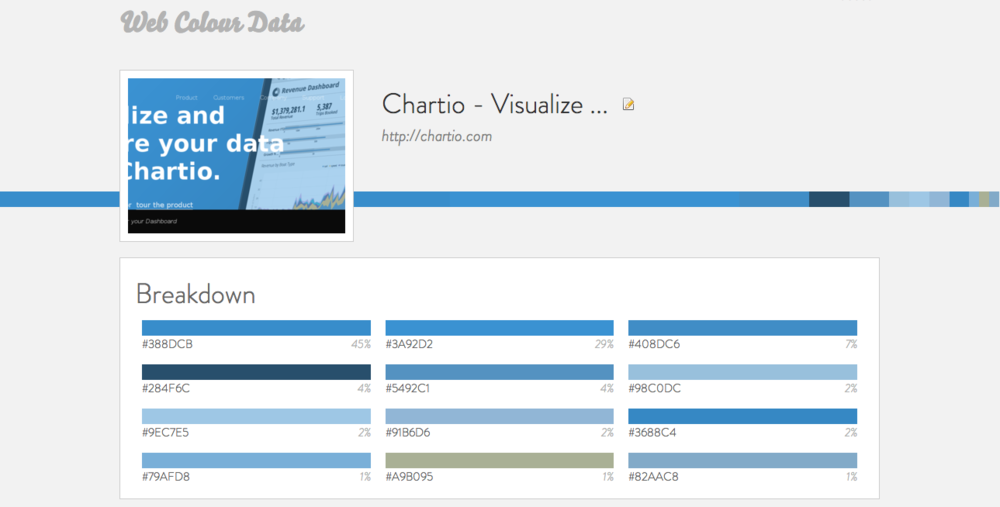
The Web Colour Data tool you created is very fun! How did that come about?
As a designer, I have always found it quite difficult to find any data about colour usage on the web. Colour is such an emotional and subjective area, and I wanted to find a way to identify trends in colour usage on the web in general and within certain industries. I also wanted to answer questions such as ‘what is the most common colour on the web?’
The main purpose of the tool was to collect colour data of websites. So I tried to encourage people to help me populate the dataset by entering in urls in return for a visualisation of colour stats for that page. With this data, I hoped to get better guidance and justifications for my own design decisions. To date, it has crunched through over 60k websites. Unfortunately I haven’t yet had the chance to thoroughly analyse the data. Although one interesting find from a few months ago is that Celestial Blue is the most frequently occurring.

You describe yourself as working at the intersection of design, art, technology and science. Can you elaborate?
I have always had great admiration for successful generalists who can combine multiple interests in their work. I try to blend all these fields into my work, but from a design perspective.
I have been quite obsessed with geometry lately, which is a fitting example of where art and mathematics intersect. I find work by artists such as Andy Gilmore and Simon Page inspiring. There are also other concepts in the math and science world that blend so well into art such as strange attractors, chaos theory and sound waves (eg. cymatics). Many liberal arts and creative thinkers shy away from the scientific and technical, but there is so much beauty in those fields that have potential to inspire great works. Conversely, scientists and technologists tend to steer away from art these days, but one of the greatest minds in history, Leonardo Da Vinci, combined both in his work.
Many liberal arts and creative thinkers shy away from the scientific and technical, but there is so much beauty in those fields that have potential to inspire great works.
And lastly, what are some of the core challenges you face as an interactive designer?
The thing I’ve struggled with the most in my career has been the division between code and design. I’ve seen time and time again teams that have a ‘throw it over the wall’ process. The designer will mockup something in photoshop and then the developer will try to transfer the design in code. Working this way has always been frustrating to me because I don’t feel like I can ‘touch’ what I am designing. I do believe that designers of digital products, at a minimum, should understand the capabilities of the medium they are designing for. In the same way an architect must know how a building is to be built and with what materials. Many designers try to do this by keeping up with trends and libraries, but there’s nothing that beats getting into the code yourself. I hope this will become easier as we create more tools to bridge the gap between building and seeing what you’re building, without limiting the types of designs you can create.
Related Content
-

Startups, Data and Fundraising - an Interview with Amanda Kattan
Amanda Kattan data and finance consultant -

Data for Good with Aziz Alghunaim, Co-founder and CTO of Tarjimly
Aziz Alghunaim Co-founder and CTO Tarjimly -

An Interview with Daniel Mill of The New York Times
Daniel Mill Director of Marketing Analytics The New York Times