From Despair to Delight: Lessons From Our Biggest Product Launch
Posted by on May 28, 2020 Chartio
Imagine this. You’re prepping for a board meeting or working on a problem definition doc to support your next product release and you find yourself stumped on a company you’d like to reference. Normally, your first instinct would be to fire up Google and search for answers. But what if you couldn’t? What if there were a huge learning curve that you’d have to overcome to use the search engine?
This most likely never happens, but what if it were the case: what if only 5% of your company knew how to use Google? This is the analogy we reference when we talk about how and why we built Visual SQL. Our customers consistently rated Chartio as the most usable product, yet the data showed that only 1 in 10 of users were able to make their own charts without any roadblocks.
1 in 10 was not enough. Not even close.
So we tested and iterated. Rinsed and repeated over a 100 times. Yes, you read that right. We went through thousands of design iterations, created dozens of functioning prototypes, ran several hundred user tests, and clocked countless hours of development in order to solve this problem. And we did. We solved it.
On May 21st, we joined UserTesting for a live discussion to share what we learned through this extensive process. During that conversation, we revealed the sequence we followed to create Visual SQL, which now allows anyone, not just that small fraction of your workforce, to work with data. Here are some highlights.

Identify the challenge
Chartio’s mission is to make data accessible to everyone, so we needed to make a BI product easy for anyone to use. Moving the needle past that 1-in-10 statistic was our undertaking. But the challenge was bigger than that, and we needed to answer a handful of questions to get us to a starting point. So we asked:
“Why isn’t that number much higher?”
“Why is our product adoption rate at a standstill?”
“What can we do to get that number up?”
Identifying your challenge dictates the path towards a solution and becomes the foundation of the product you need to create. So before you say, “This would be a great addition to our product” or “Why don’t we add this to our roadmap,” you should ask, “What challenge does this solve for our customers?” Aligning on your challenge is the first step towards creating a product or feature that’s loved and adopted.
Commit to iteration
Once we identified our challenge, we knew we had to face what was wrong with our product, and it started with understanding the context behind how people would go about building a simple bar chart. We strapped on our customers’ shoes and went through the process as if we were them. We discovered that the largest drop-off in our funnel was coming from the chart creation process. So, despite the fact that 40% of our customers were satisfied with it, the other 60% were really struggling to create charts on their own.
It was time to pinpoint exactly what was broken in the workflow. To do that accurately, we had to run qualitative tests. Our preliminary experiments that we ran with UserTesting showed that only 1 in 10 could create a chart in the current version.
When more results came back, the team really started to feel for what our users were going through. Empathy skyrocketed and we were finally able to understand why our users were getting stuck. It was that empathy that resulted in improvements. While we were happy that 40% of customers were making strides with Chartio, it was the 60% we had to focus on. Quantitative analysis is key, but it can skew perception and decisions as you most likely are getting feedback from the power users who were already used to the product and past the learning curve.
We’re human and a bar chart doesn’t instill a lot of emotion. But watching someone struggle drives emotion and empathy to make changes and in our product.
– Dave Fowler, CEO/Founder @ Chartio
Smart testing and iteration is key. It’s easy to get wrapped up in preliminary wins, but success comes when you go beyond the easy part and think past the early results. That’s when progress is really made.
Don’t settle for okay results
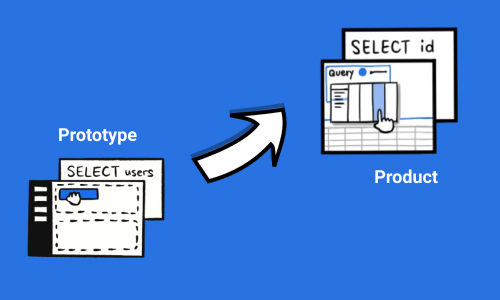
We became addicted to this pattern: test, iterate, test, iterate and so on. We loved hearing and documenting reactions and input from our users. We continued this process until we were confident (and had the data to prove it) that the majority of our customers could build charts without friction. We didn’t want to stop at a mediocre number. It sounds like a lot of work, but it can easily be done in batches. Rather than designing and launching immediately, we made multiple prototypes approaching this solution from different angles and user-tested each prototype in batches of 10.
“Feedback takes too long.” Wrong. This is a common misconception. Our team was able to swap out the different prototypes easily and get results in batches within an hour. This is one of the main reasons why we use UserTesting – the platform gives you the confidence of hindsight and the ability to understand what issues your users are facing almost immediately. So as you think about the timeline for product iteration, you don’t need to think in terms of months; results are closer than you may think.
Listen to failures
Tests and prototypes can still leave you stumped. There is no magic formula to get a perfect product the first time, or even the tenth time. But taking a dual approach to user testing data—both quantitative and qualitative—puts you on the right path that will lead you towards a successful version that’s ready to be launched.
We learned this first-hand. Even after hundreds of user tests and dozens of prototypes, we were disappointed to find that the numbers weren’t moving past a certain threshold.
“I remember thinking we were completely out of ideas – it put me in despair. Instead of solving this problem, what I’ve done was prove to myself it was impossible. The whole mission that I had for the company, I thought I had proven it to be impossible,” Dave recalled.
Then the final prototype came out, and we heard, “I love this, it’s so simple – I can actually do this.” We saw a wave of excitement spread across the company along with a sense of relief that months of our efforts have not gone fruitless. From there, we started making a little tweak here and there, and after a couple more iterations and user tests, we were finally able to get the number from 1 in 10 up to 8 out of 10. Now 8 in 10 people could create charts in what would become our biggest product release in our 10 years of existence: Visual SQL.
We found a way for companies to empower everyone – not just data teams – with data.
By listening to failures and examining the qualitative data with a fine-toothed comb, you are able to make smart and impactful changes in a product. It becomes the grounds for creating a solution that is loved by your customers.
Repeat moving forward
Building Visual SQL was no doubt a long process. Every design, prototype, test and iteration taught us something about our customers and their needs. By identifying our challenge at the beginning of this operation, we were able to carve out a clear focus and identify what to test, which led to smart iteration. With iteration came wins, which helped us move forward in some areas, while the failures empowered us to go back to the drawing board until we got it right.
It’s been two months since the launch of Visual SQL. In those two months we’ve also delivered two significant product releases: chart comments and Interactive Embedding, both of which followed a similar approach to testing and development.
Data can be used to answer a lot of questions, but not everything - you need to be able to test assumptions. Had we actually gone with building 10 versions of our product, we would have spent time on things that didn’t work.
If you haven’t already, please check out the on-demand webinar here.
As a CEO of a data company, as much as I’d love to say that all you need is quantitative data, you can’t do one without the other.
– Dave Fowler, CEO/Founder @ Chartio


