We’re really excited about all of the Chartio news today. Not only did we get to announce some funding (more on that later), and a new services offering, but we’ve launched two new product features that we feel are major game changers for cloud Business Intelligence.
There’s a lot to talk about, so let’s get started with the new features.
Blending
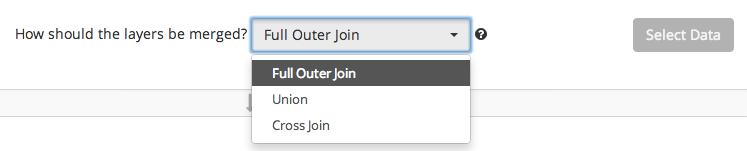
Chartio now enables queries from different data sources to be combined (blended) together for visualization or further analysis. Data is fetched from different sources using multiple layers and then blended together with one of three different methods that are controlled by a simple drop down.
The blending process, we think, will have a huge impact on the standard Business Intelligence workflow.
Traditionally, organizations needing to do analytics across multiple data sets had to undergo the enormous process called “Extract, Transform, Load” or ETL for short. The process typically takes several months as a data team needs to design a data warehouse with all of the data loading processes involved, while predicting any possible analytic questions that may arise in the future.
ETL is an incredibly difficult and costly task and blending removes much of the need for it.
With blending, an engineer doesn’t have to predict what may be interesting to chart or what all of the data sources will be months in advance. A user can just get going and worry about combining the data later, when the chart is actually being made. All queries are pulled from the live sources and very little extra work is needed to determine how the data is combined.
For more information see the data blending documentation or watch the following video tutorial.
Formulas
The new Chartio Formulas enable you to create new calculated columns based on other columns in the query result set. It is quite similar to how you might create new formula based columns in Excel and is built right in as an optional step in the chart creation process.
The following example shows a formula generating a new column that is the four week moving average of another column in the data set.
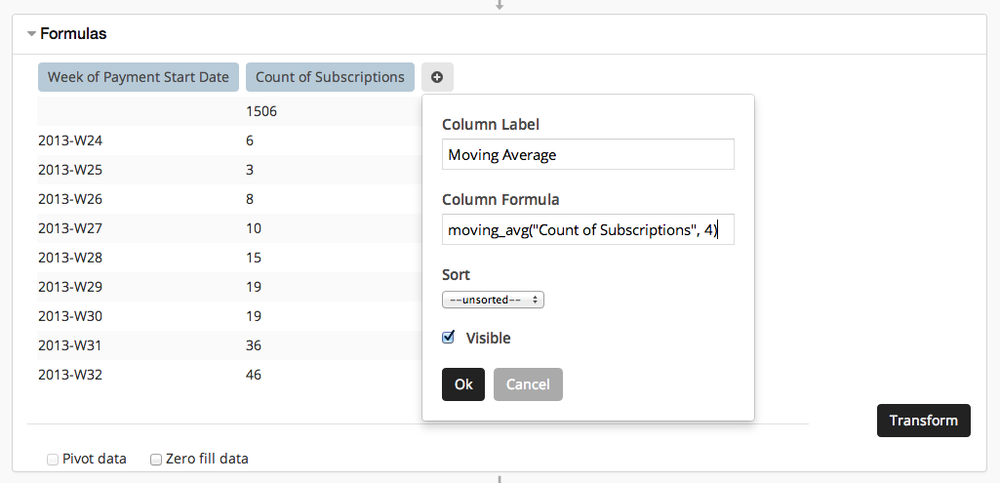
A formula creating a 3rd column that is the Moving Average of the 2nd using the moving_avg function.
Formulas are especially exciting when mixed with Blending. The following two images show a a formula for mixing Google Analytics data with Subscription data from a database to calculate a conversion percentage for page visits to paid customers.
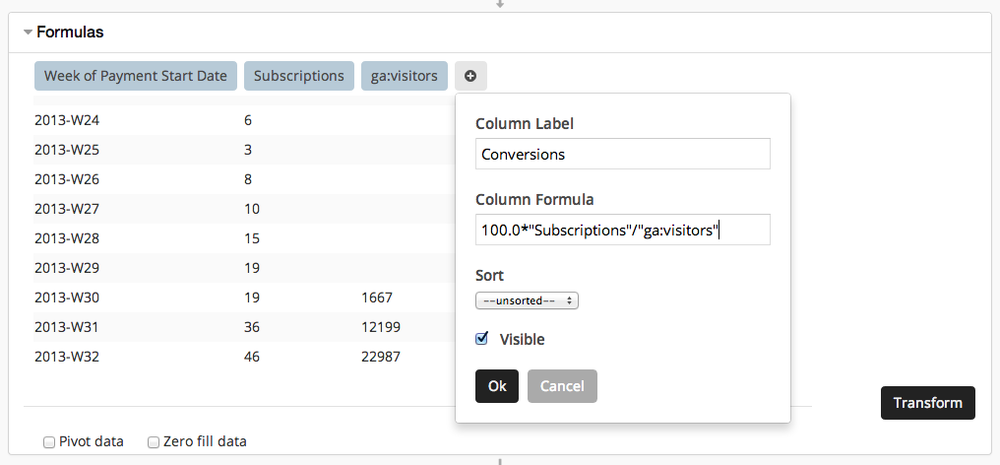
A Formula combining two blended columns into a conversion metric
The formula is simply written using the names of the blended columns, and multiplying them by 100.0 to get the value as a percentage.
100.0 * Subscriptions / ga:visitors
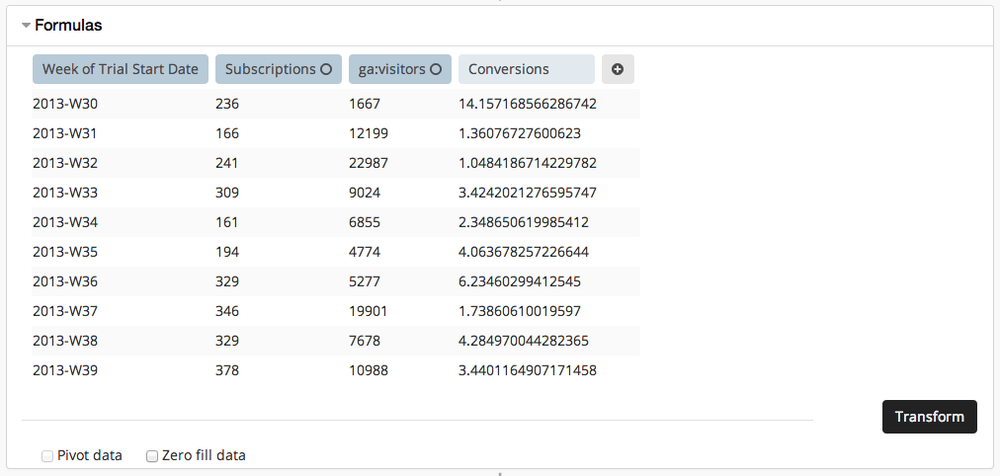
The resulting calculated column of the conversion rate from visitors to paying customers.
Once defined and the Transform button is clicked, the formula is applied to every row in the new column, and the values can be visualized in the final visualization step just like any other data in Chartio.
Again, no ETL or data warehousing was needed to merge these two data sources. The query sets from both were simply blended together and the conversion was calculated using a formula!
For a further explanation see the formulas documentation.
Services
We’ve been focused for a long time on providing an easy to use self-service Business Intelligence solution. We frequently, however, run into customers who want more than a product, but also the time and expertise of experienced data scientists and database administrators.
To meet those needs we’ve recruited an experienced team and are now offering analytic services for hire.
Funding
Lastly, in order to support our new offerings and further accelerate our growth we’ve raised another $2.2M in funding from Avalon Ventures. The round also includes a new investor, Jeff Fluhr who is a founder of StubHub and spreecast. We are excited to include Jeff as the second investor to come to us first as a happy customer!
We’d love to hear what you think of the new announcements! If you have any thoughts, questions, or requests, as always send us a note at hello@chartio.com.


