The Drunkest Countries
Posted by on September 11, 2014 Data, Data Analytics
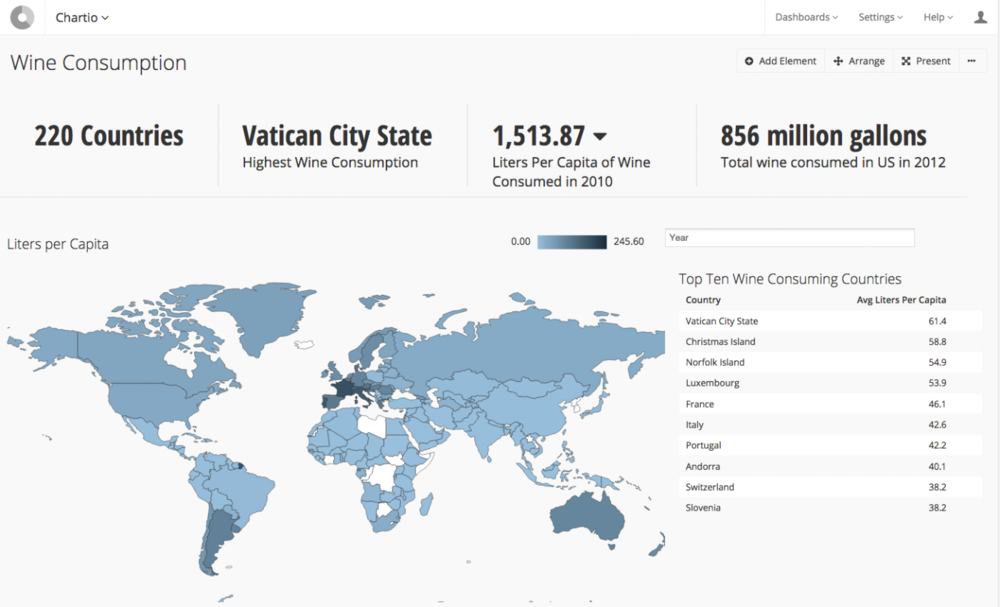
We have a data visualization about San Francisco bars, but since we now have maps to use I think that requires a worldwide drinking visualization. Although I would not consider myself a wine expert, it is one of my favorite things to drink, so it felt fitting that I focus this visualization on wine. I found these data sets from the Wine Institute about per capita wine consumption in the world from 2007 - 2010, as well as wine consumption in the_ U.S. from 1934 - 2012. (note: I didn’t use the latest data that included 2011 per capita wine consumption because it is reported in a PDF that I could not extract data from)_

Who Drinks the Most?
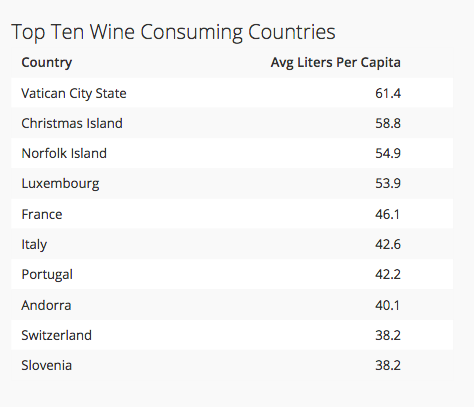
The per capita data set included 220 different countries, from a four year time span (2007 - 2010). Over those four years, Vatican City always held the number one spot for most liters of wine consumed per capita. Let’s give them the benefit of the doubt and say that its all for ceremonial purposes, but it sounds to me that the Pope could be the world’s number one wine drinker?
The next top contenders for most wine consumed are Christmas Island, Norfolk Island, Luxembourg, France, and Italy.

Christmas Island is a bit of an anomaly as a “Top Ten Wine Consuming Country”. The population is low, and while the per capita consumption is high-ish for 2007 (16.24), 2009 (13.49) and 2010 (17.70), the average per capita consumption in 2008 was astronomically high (187.92). Resultingly, the average per capita consumption was the second highest. I haven’t found an explanation for this gigantic leap in consumption for one year - so I am admittedly a little suspicious.
More interesting, is that Norfolk Island and Luxembourg are top wine consuming countries. We expect to see France and Italy in the top ten but not the tiny Australian island, known for its pine. These countries are not in the top ten due to irregular data, as in each of the reported years Luxembourg and Norfolk Island have high liters per capita consumption, ranging from 48 - 59 liters per capita. It sounds to me that these countries love their wine, so I think I have some new “must visit” destinations!
How Much Does the United States Drink?
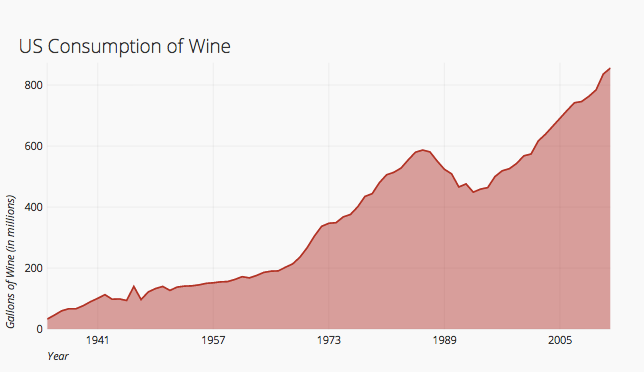
I am a bit embarrassed that the United States doesn’t even make the top ten in wine drinking, with an average of 9.1 liters per capita, we hold the 60th place. But that doesn’t mean the U.S. drinks wine lightly. Looking at the latest data, in 2012 the United States drank a combined 856 million gallons of wine. I can only imagine what damage the Vatican did in comparison!
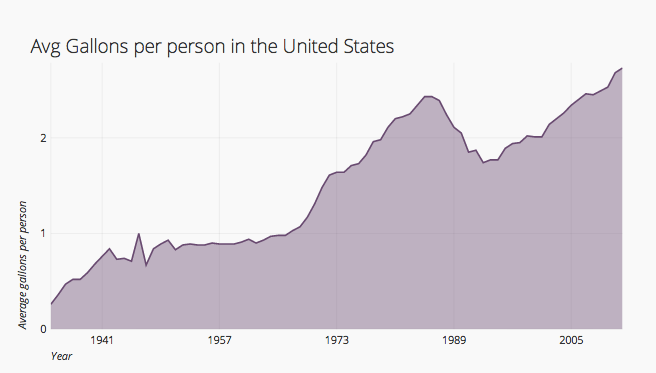
I also would say, the U.S. is not lacking effort. We have increased our intake over the years, not just as a group effort but also individually.

After a steady climb through the years, there was a drop in the late 1980s, thought to be caused by the anti-drugs and alcohol campaign in the 1980s. Thankfully, since the early 90’s the United States is back on its way to embracing wine!

It seems that in the United States, we are close to averaging almost 3 gallons of wine a person per year. In the spirit of American competitiveness, I challenge everyone to grab some Carlo Rossi so we can climb to the top for next year!


