Chartio Receives Top Awards in G2 Crowd’s Fall 2018 Indexes for Self-Service Business Intelligence
Posted by on September 20, 2018 Chartio, Customers, Business Intelligence
We are excited to announce that Chartio has been ranked #1 in all four G2 Crowd indices, including “Fastest Implementation”, “Best Usability”, “Best Relationship” and “Best Est. ROI,” in G2 Crowd’s Fall 2018 Index Reports for Self-Service Business Intelligence. G2 Crowd is the leading business intelligence software review platform, where you can put Self-Service Business Intelligence (BI) tools in a head to head comparison.

The G2 Crowd scores are calculated by a proprietary algorithm that quantifies real-user satisfaction ratings from related review answers submitted by real users. These reports are for products in the Self-Service BI category - which are designed to be used by non-technical business users.
Here at Chartio we aim to do things differently. Our mission is to enable everyone, not just data teams, to access and analyze their data. We call this #DataForAll. The recognition of our product for usability, speed of implementation, ROI and ease-to-do-business-with highlights this commitment to taking something that’s hard and making it easy for everyone. And the fact that this recognition comes directly from our users is what makes it all so much more meaningful to us. Read more in this post on each of the Index reports and how Chartio performed against other BI solutions.
Implementation Index Report
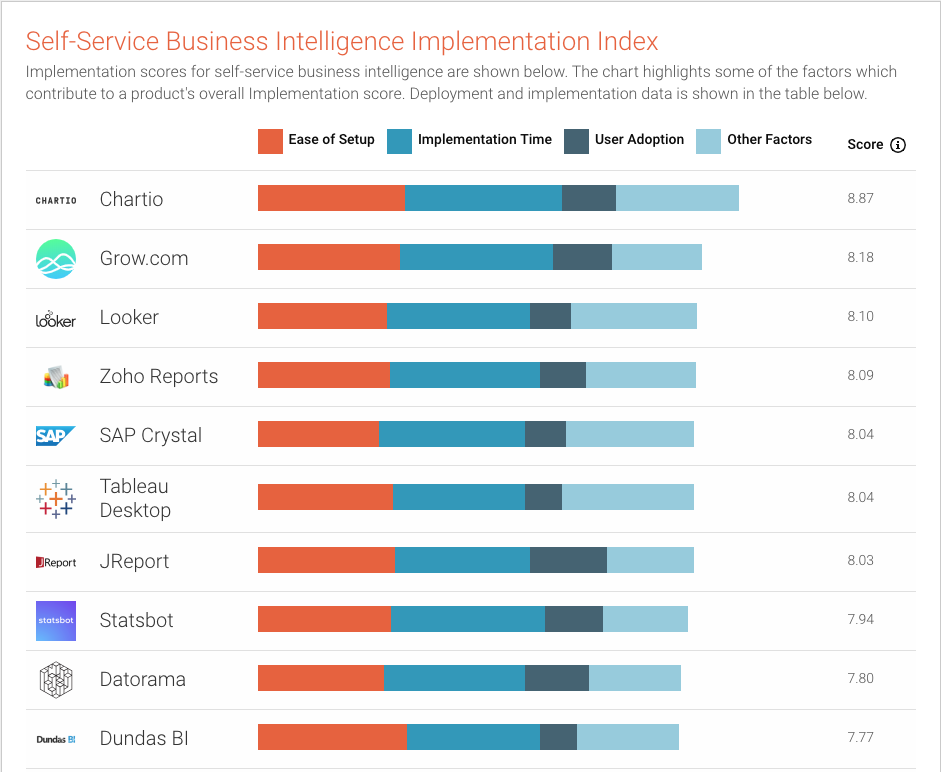
The Implementation score is determined by reviews in the Self-Service BI category to compare products based on customer satisfaction with the set-up process, the amount of time (in months) required for the product to go live, the user adoption of the product, and the implementation method used by customers. Badges are awarded to products for Most Implementable (highest implementation score), Highest User Adoption (highest overall user adoption score), Fastest Implementation (shortest go-live time), and Easiest Setup (highest ease of setup score). Chartio was awarded for Fastest Implementation, Most Implementable and Easiest Set Up in the Mid Market category.
Chartio scored an 8.87 score compared to an average of 7.3, with a 90% ease of setup, and 64% average user adoption. The average months to go live with Chartio are 0.4, or 12 days, compared to the average of 2.5 months.
Download a copy of G2 Crowd’s Fall 2018 Implementation Index for Self-Service BI to find out how Chartio outranks other BI solutions.
Usability Index Report
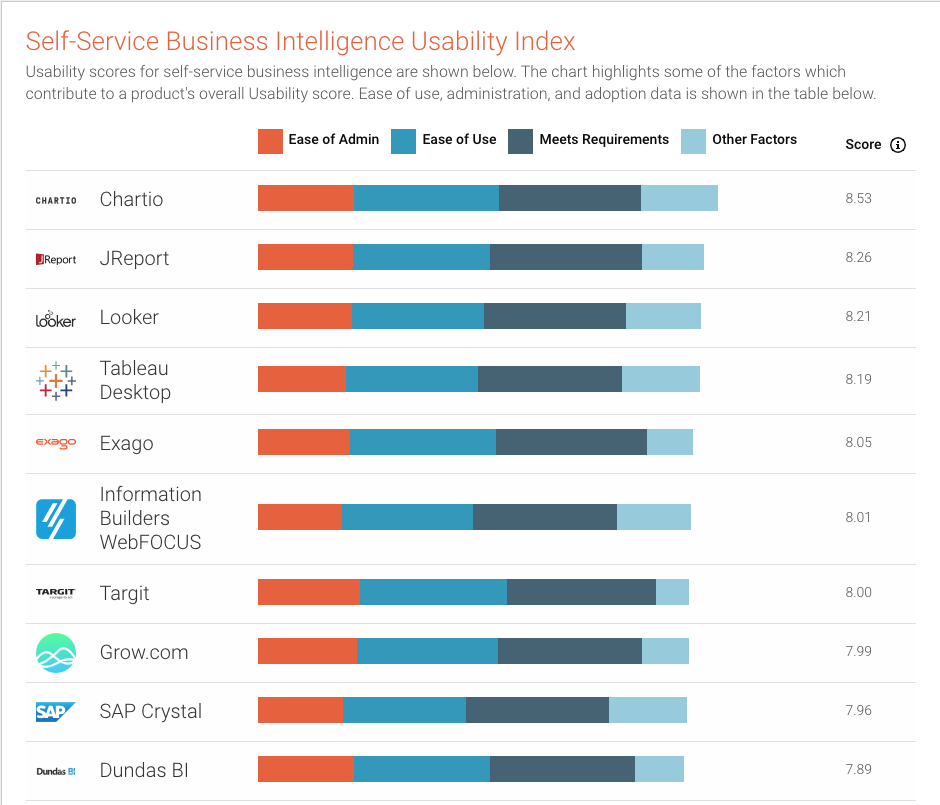
The Usability score is determined by reviews in the Self-Service BI category to compare products based on customer satisfaction with the ease of use of the product, customer satisfaction with the ease of administration for the product, ability of the product to meet customer requirements, and the user adoption of the product. Badges are awarded to products for Best Usability (highest overall Usability score), Easiest to Use (highest ease of use rating), Easiest Admin (highest ease of admin score), and Best Meets Requirements (highest meets requirements score). Chartio was awarded for Best Usability.
Chartio scored an 8.53 score compared to an average of 7.7, with a 89% ease of use, 88% ease of administration, 87% for meeting requirements, and a 64% average user adoption.
Download a copy of G2 Crowd’s Fall 2018 Usability Index for Self-Service BI to find out more how Chartio outranks other BI solutions.
Relationship Index Report
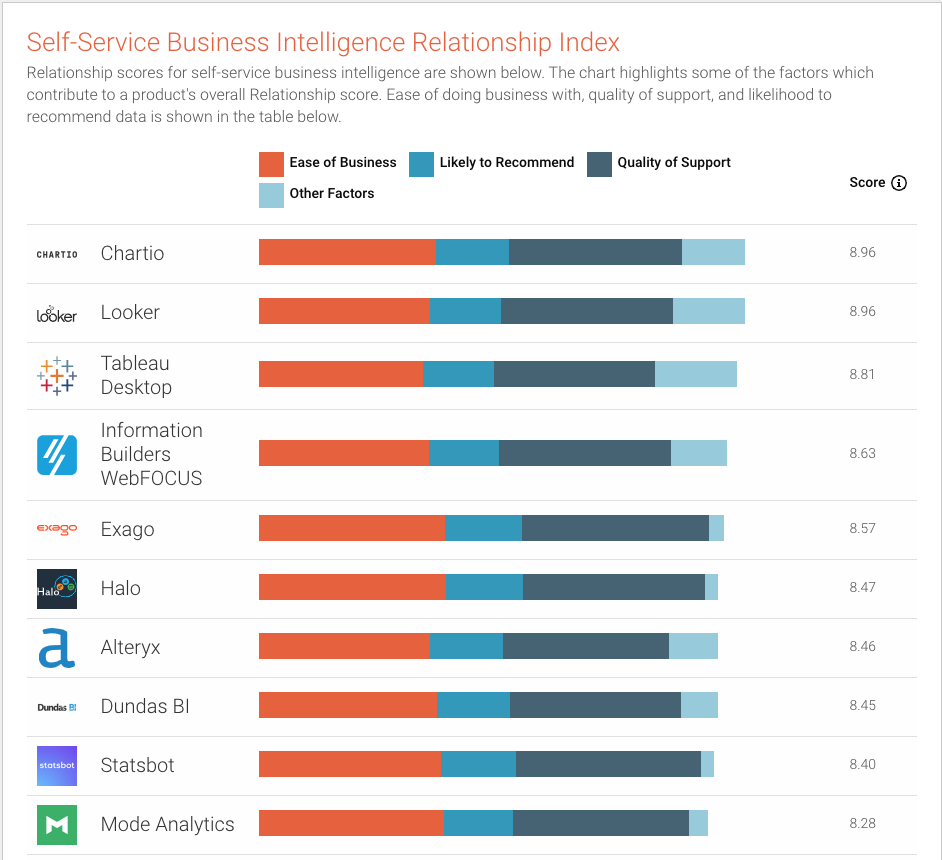
The Relationship score is determined by reviews in the Self-Service BI category to compare products based on customers’ ease of doing business with the vendor, customers’ satisfaction with the product’s quality of support, and customers’ likelihood to recommend each product. Badges are awarded to products for Best Relationship (highest overall relationship score), Highest Quality of Support (highest overall quality of support score), and Easiest Doing Business With (highest ease of doing business with score). Chartio was awarded for Best Relationship.
Chartio scored an 8.96 score compared to an average of 7.9, with a 89% likelihood to recommend, 92% ease of doing business with, and 90% quality of support.
Download a copy of G2 Crowd’s Fall 2018 Relationship Index for Self-Service BI to find out more on how Chartio outranks other BI solutions.
Results Index Report
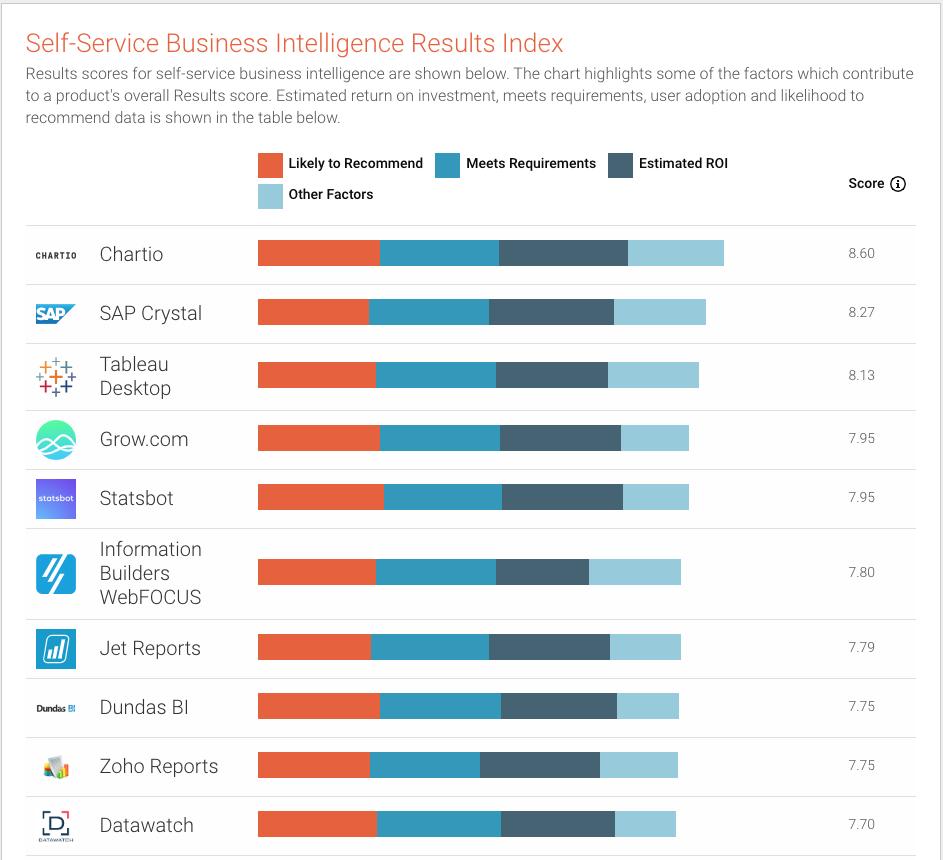
The Results score is determined by reviews in the Self-Service BI category to compare products based on customers’ reported ease of doing business with the vendor. Badges are awarded to products for Best Results (highest overall Results score), Best Estimated ROI (based on a combination of estimated time to ROI and time to go live), and Users Most Likely to Recommend (highest likelihood to recommend score). Chartio was awarded for Best Est. ROI and Best Results.
Chartio scored an 8.6 score compared to an average of 7.7, with a 89% likelihood to recommend, 87% meets requirements, 64% average user adoption, an estimated ROI (months) of 8.5, compared to an average of 13.4, and an average time to go live of 0.4 months, compared to an average of 2.2.
Download a copy of G2 Crowd’s Fall 2018 Results Index for Self-Service BI to find out more on how Chartio outranks other BI solutions.
