Today we have rolled out support for uploading Comma Separated Value (CSV) data files as a data source. CSV is an incredibly universal format for data, and we’ve heard overwhelmingly from our users that an important component to their business data has been locked up in these files.
We took our time building out this feature as it is a first step in providing upcoming support for more 3rd party data sources, and because we wanted to get the interface just right. I’d like to walk you through some of the details of our implementation.
Multiple File Upload
It is common for a data set to be spread over multiple related CSV files, so we use a multiple file upload input to load all of your CSV files at the same time.
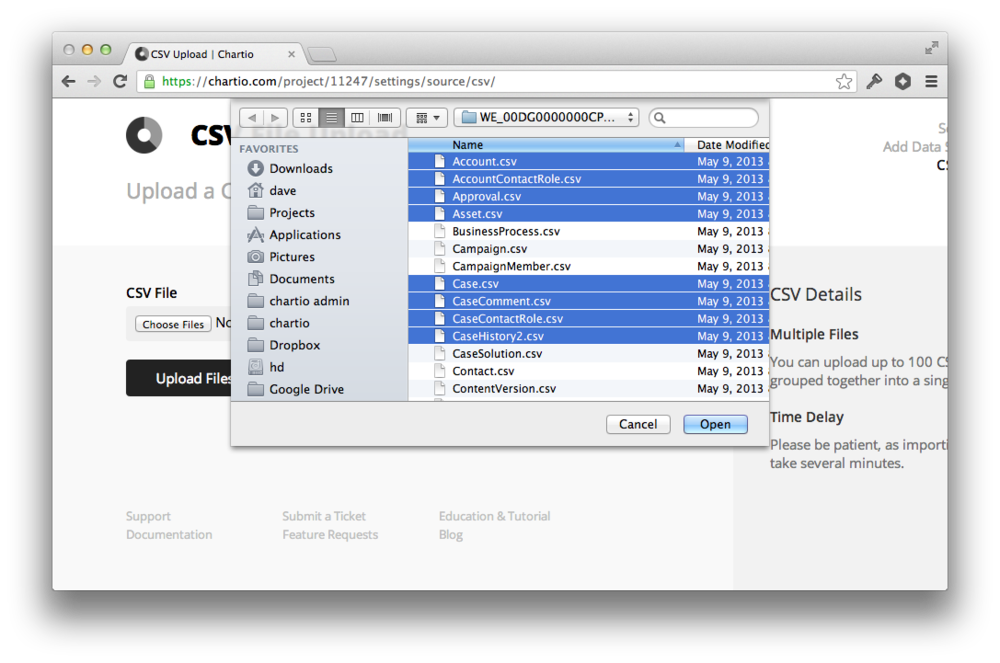
Each file is treated as an individual table in one common data source, and joins can be setup in the schema editor for queries to automatically connect across the different files.
Auto Type Detection
When your files are uploaded we scan the data for patterns and make best guesses at casting the column values to data types such as Integers, Dates and Text.
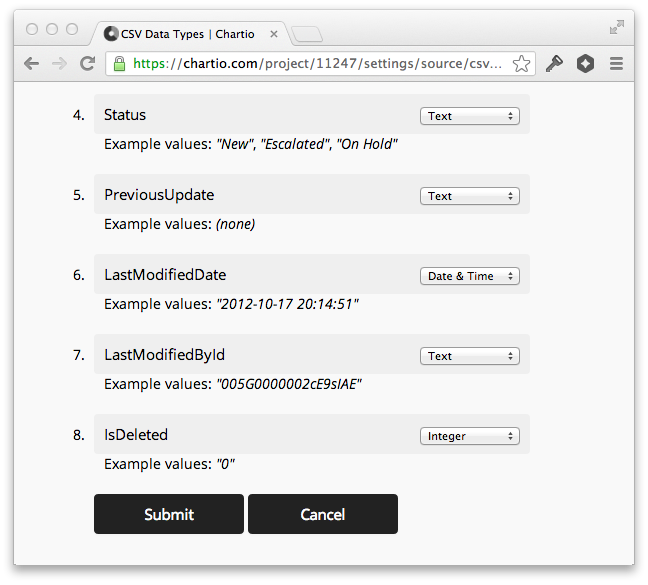
Our guesses for each column, along with some example values are presented for your approval and adjustment. There are many different formats that people use to represent dates and times, but I think we do a really nice job of detecting them.
Descriptive Error Detection
Rarely is data perfectly clean. While processing the data we do our best to handle any issues, but if there is nothing we can do, we display a descriptive error on what went wrong and where in the file it can be fixed.

Easy Updates
Common sources of CSV files are 3rd party services that allow you to periodically export your data. For these cases we’ve built an easy update option for each CSV data source.
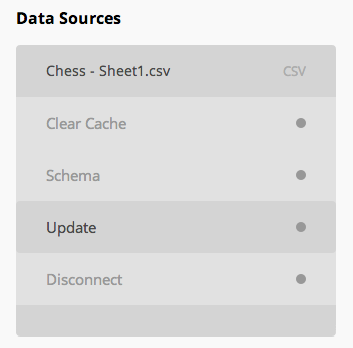
Simply upload the latest copy and we’ll format it as you’d previously specified, replacing the old data with the new. All of your charts will automatically be updated.
Query with SQL
For most cases the Chartio drag and drop chart creator will be enough to create all of the visuals you need from your CSV data. But it is interesting to note that the data uploaded to Chartio is put into a SQLite3 database, and treated like any other database inside of Chartio. The schema can be edited, columns aliased, joins created, and if you’re adventurous you can even write raw SQL!
Example: Chess at Chartio
We play a lot of Chess at Chartio and several months ago we started recording the results of our games on a spreadsheet and plotting the results in Chartio.
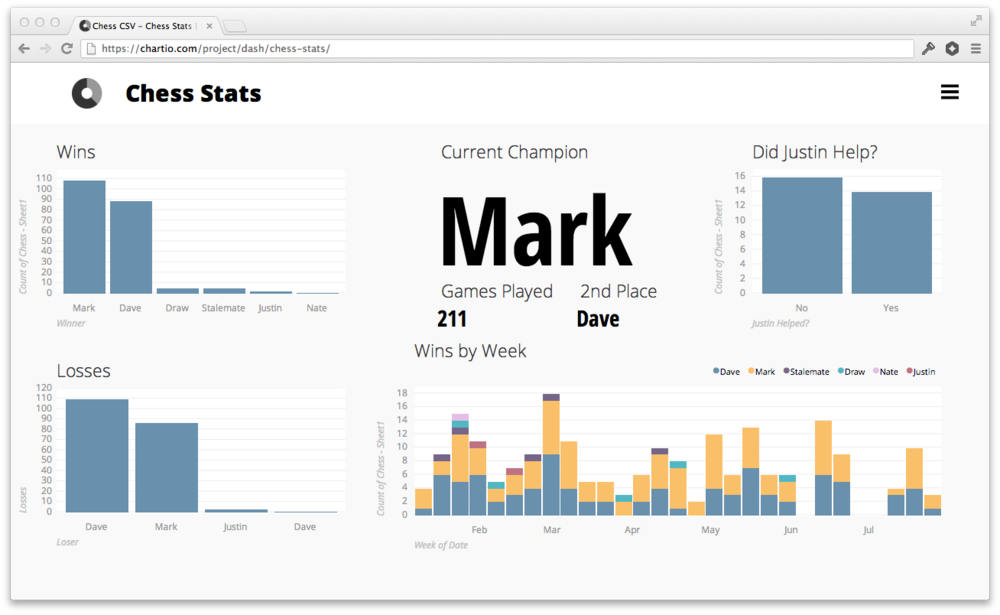
As you can see Mark is the current office champion, but I think I see a bit of a comeback trending in my stats. The second dashboard on the project allows you to specify a white_and _black player and view the stats of all such match-ups.
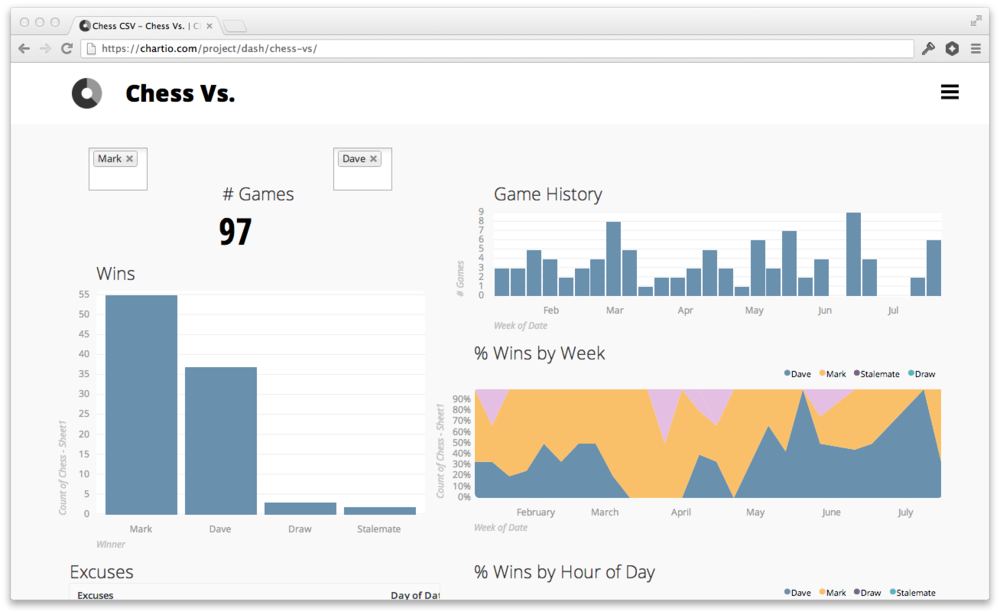
In the % Wins by Week chart you can clearly see my upward trending dominance. I was sick for much of March and you can see that it really affected my game. I use that as my excuse for Mark getting his current 20 game lead! Feel free to click through those images and play with adding your own charts.
Try it Yourself
If you’d like to get started with your CSV data you will now see it as an option in the datasource connection menu. Be sure to check out our CSV documentation for more details, and if you have any questions, please don’t hesitate to send us a note at support@chartio.com.
