We build a LOT of dashboards and one of the many things we’ve learned is that they often need more than just charts. Sometimes adding context with a brief description or grouping sections with a separator is just as valuable to a dashboard as the charts themselves.

To help with this we’ve added some additional elements for dashboard layouts and slightly changed the way new dashboard elements (including charts) are added.
A More General Add Button
The first thing you may notice is that the Add Chart button in the upper right of your dashboard has been replaced by a general add button. Clicking this add button now opens a menu of element options.

From there you can add a chart or a global filter as was possible earlier, but now you can also add any of the following:
Description Text
A major user request has been to add extra context to charts and dashboards.
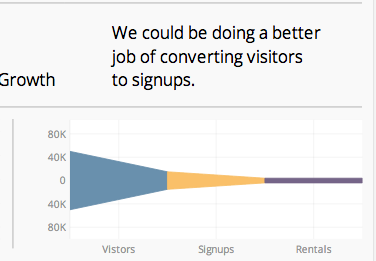
There has long been a workaround to make a single value chart with a query of
SELECT "My text here";
but now we’ve created a proper interface for adding text blurbs to dashboards that works much like adding text in PowerPoint or Keynote.
Header Text
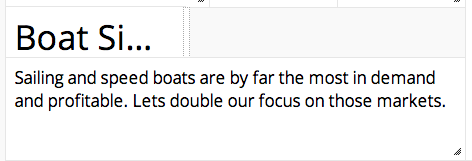
Header text, such as Boat Signups pictured below is similar to the description text but of a larger font.

Additionally the header text can only be a single line. If your header text is too big for the container it does not word wrap but is truncated with an ellipsis.
Horizontal and Vertical Rules
Lightly stated lines are a great way to unobtrusively group and separate sets of data. The new Horizontal Rule and Vertical Rule elements enable those dividers to be added to dashboards in, again, a similar manner as adding lines in PowerPoint or Keynote.

Editing and Arranging
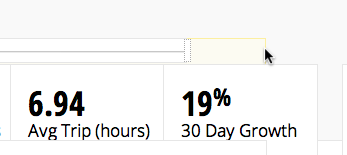
Editing, arranging, and resizing these new dashboard elements works in the same way that charts do; simply put the dashboard into arrange mode and drag, drop and resize as you please.
To edit the text or settings of these elements open the settings gear that appears when hovering over the element.
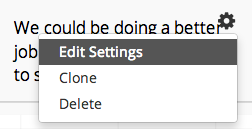
These settings are where the content for the Header Text and Description Text elements are set and edited.
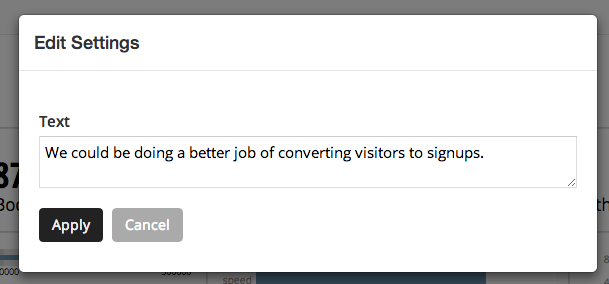
Chart Settings Now Adjustable on Dashboards
Lastly, in addition to the added elements, we’ve made some improvements to how charts are interacted with on the dashboard. The settings of each chart are now editable on the dashboard level.
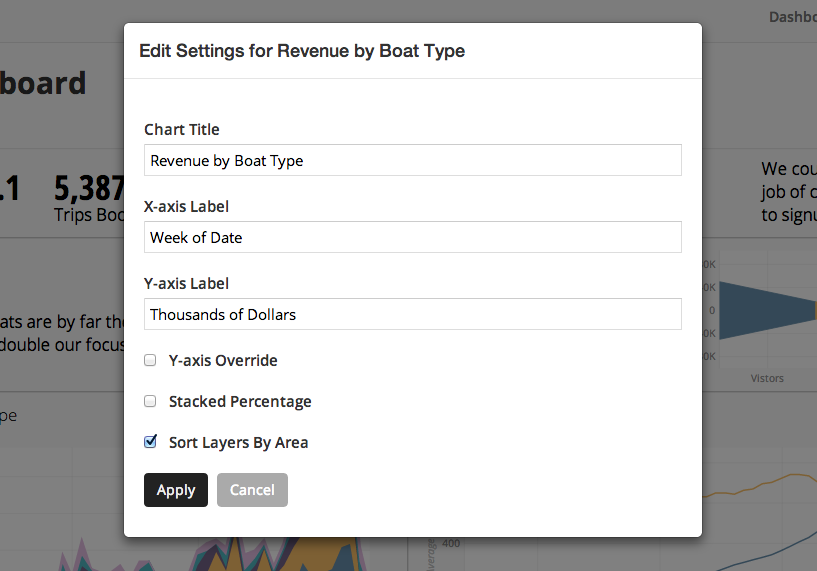
The chart edit menu of each chart now has an option to Edit Settings which opens the window shown above to edit the title, labels and other configuration settings for the chart.
A huge thanks to all of those who contributed requests and feedback for these features! If you have comments on the implementation or other features to request be sure to send us a note at hello@chartio.com.
