We’ll periodically keep you updated on some of our smaller, but still very cool features that have come out recently.
We’ve improved Global Filters and renamed them Dashboard Variables
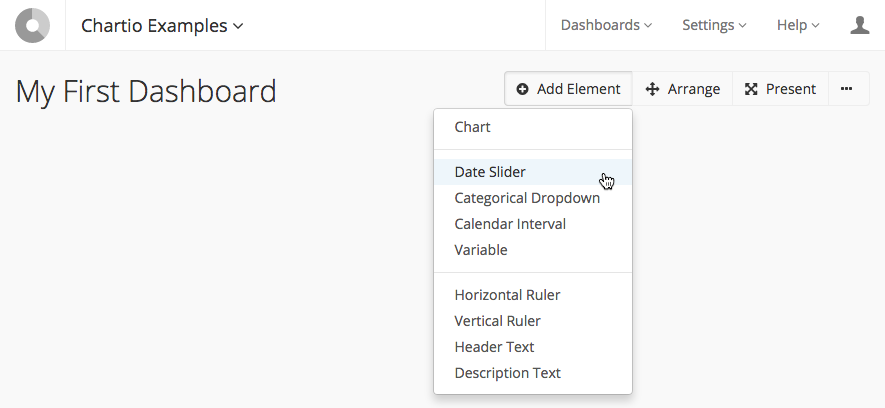
We recently updated Global Filters, and now they are called Dashboard Variables. Dashboard Variables are variables you can set on a dashboard-wide basis. They allow you to apply filters to multiple charts simultaneously. Dashboard Variables will work the same as Global Filters, but now you can choose from more filtering options. Learn more about the variable types and how to create one in the docs.

The Data Pipeline can now filter rows
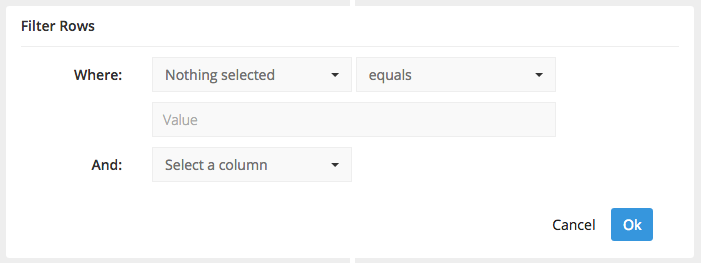
We added another pipeline step that allows filtering rows by attributes of the columns. The filter step uses AND logic for each condition, so a row will be removed only if it does not match all of the conditions you have added. Learn more about filtering rows in the docs.

You can now select and move several charts at once
Use the mouse to arrange multiple charts at once. Ctrl+click the charts you want to move, and drag to the new location. Single clicking without dragging will deselect charts, and you can arrange the charts one-by-one.

Run queries without touching a mouse
We added a query keyboard shortcut to allow you to run a query without a mouse. In the chart creator, pressing Ctrl + Enter (or Command + Enter on OSX) will re-run the query.
We hope you enjoy this brief summary of some new releases. Be sure to let us know what you are next hoping to see at support@chartio.com or on Twitter @chartio.


