Why SAP Still Doesn't Get It
Posted by on May 26, 2011 Opinion, Data Analytics
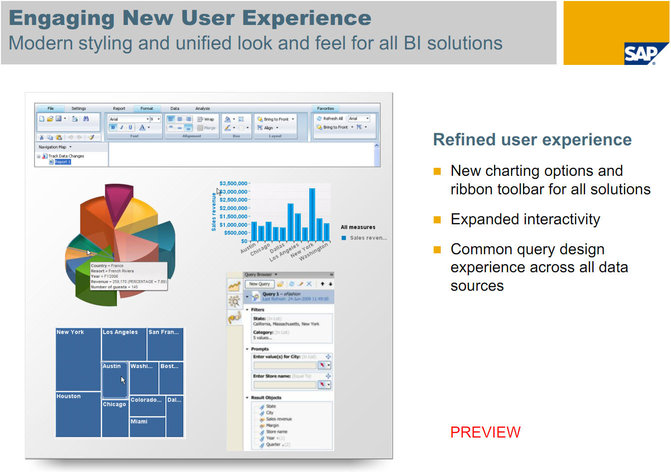
I recently came upon a presentation slide showcasing SAP’s new BusinessObjects 4.0 suite. It was entitled “An Engaging New User Experience.” Please note the irony.

Needless to say, they are setting the bar quite low. As Brian Pierce of Perceptual Edge wrote:
As you can see, SAP’s idea of an “engaging new user experience” includes a 3-D pie chart that looks like an abstract Jello sculpture.
In discussing analytics and visualization with Chartio customers, I have come across a few poor souls who’ve used SAP products for business intelligence. Generally, the complaints hew to the same point: It’s quite unusable. However adept old-guard BI vendors may become at improving the processing power or speed of BI (in-memory analytics aside, which is very useful in making the presentation of data interactive), they still miss the point on ensuring the data is presented in a good and usable form.
I think some of the problem stems from the way business intelligence is understood in organizations. In many cases, it is a fancy way of saying “reports.” Depending on the size and type of organization, reports are mostly static entities presented at quarterly meetings to management. In which case, report authors have abundant time to conceive and execute. So they can, in fact, lean heavily on IT to clean up the data, formulate the perfect query or correct their mistakes caused by complex and unusable software. In this scenario, the buck still stops with IT and the business end-users are left in a somewhat helpless state.
A lot of the UI improvements around the older and mega BI businesses could almost be described as “UX Washing,” which is analogous to the concept of “Greenwashing.” Greenwashing describes companies that market themselves as being “green” or taking green initiatives without actually doing what they claim (or grossly exaggerating it). This UX washing adds a veneer of usability around a product, the core structure of which, is flawed.


