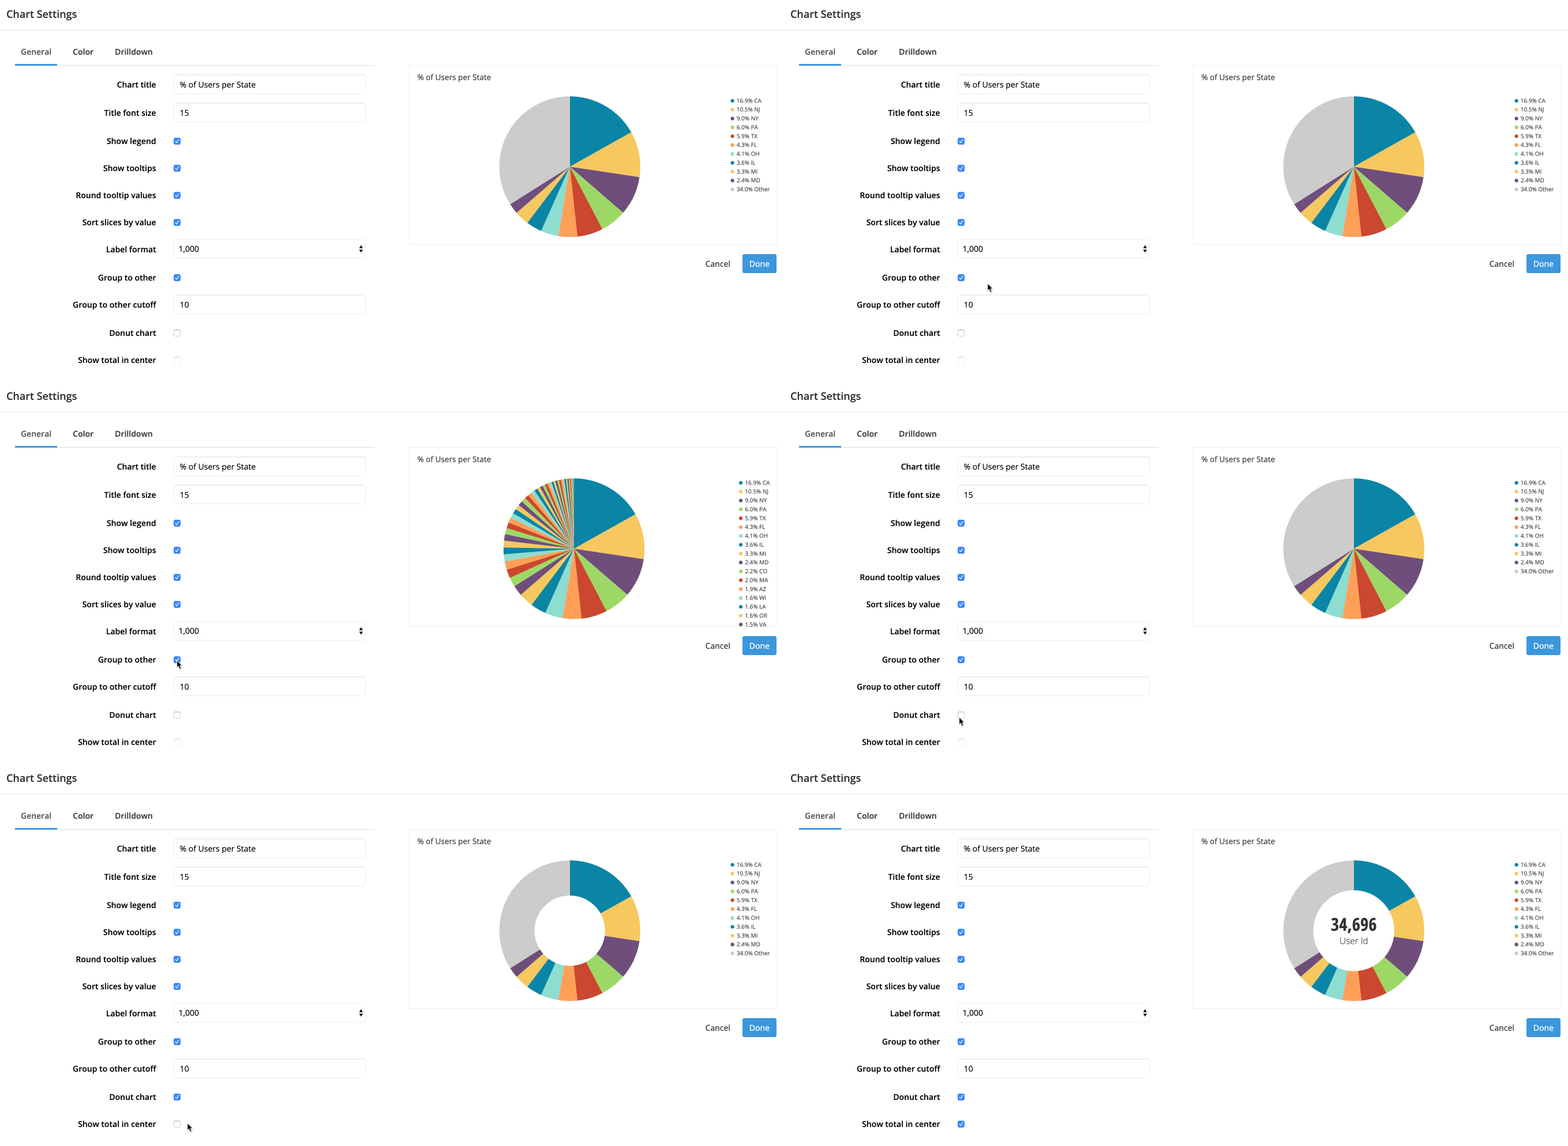
Pie Chart Settings
If you joined after November 17, 2020, check out our Vega chart settings for more relevant info.
Available chart settings tabs for Pie charts
| General | Color | Drilldown |
General
“Chart title”, “Title font size”, “Show legend”, “Show tooltips”, “Round tooltip values”, and “Label format” can be found in the General section of our Chart Settings page.
- Sort slices by value
- Sorts pie slices from greatest to least in terms of value
- Group to other
- If your Pie chart has a lot of small data segments, we may automatically group those segments together into an “Other” slice to clean up the chart output; selected by default
-
Deselecting displays all results separately (i.e., no auto-generated “Other” slice)
- Group to other cutoff
- Editable when Group to other is selected
-
Specify the maximum number of slices to show in the chart; remaining slices are grouped into “Other”
- Donut chart
- Turns your Pie chart into a Donut chart
- Show total in center
- Editable when Donut chart is selected
-
Show the total value (i.e., sum of all slice values) in the middle of your Donut chart

Color
“Background color” and “Use custom colors” can be found in the Color section of our Chart Settings page.
Drilldown
Check out Drilldowns for more information on this tab.