Data Pipeline

Basic vs. Advanced Data Pipeline
When creating charts, you have the option to toggle between two modes of our Data Explorer:

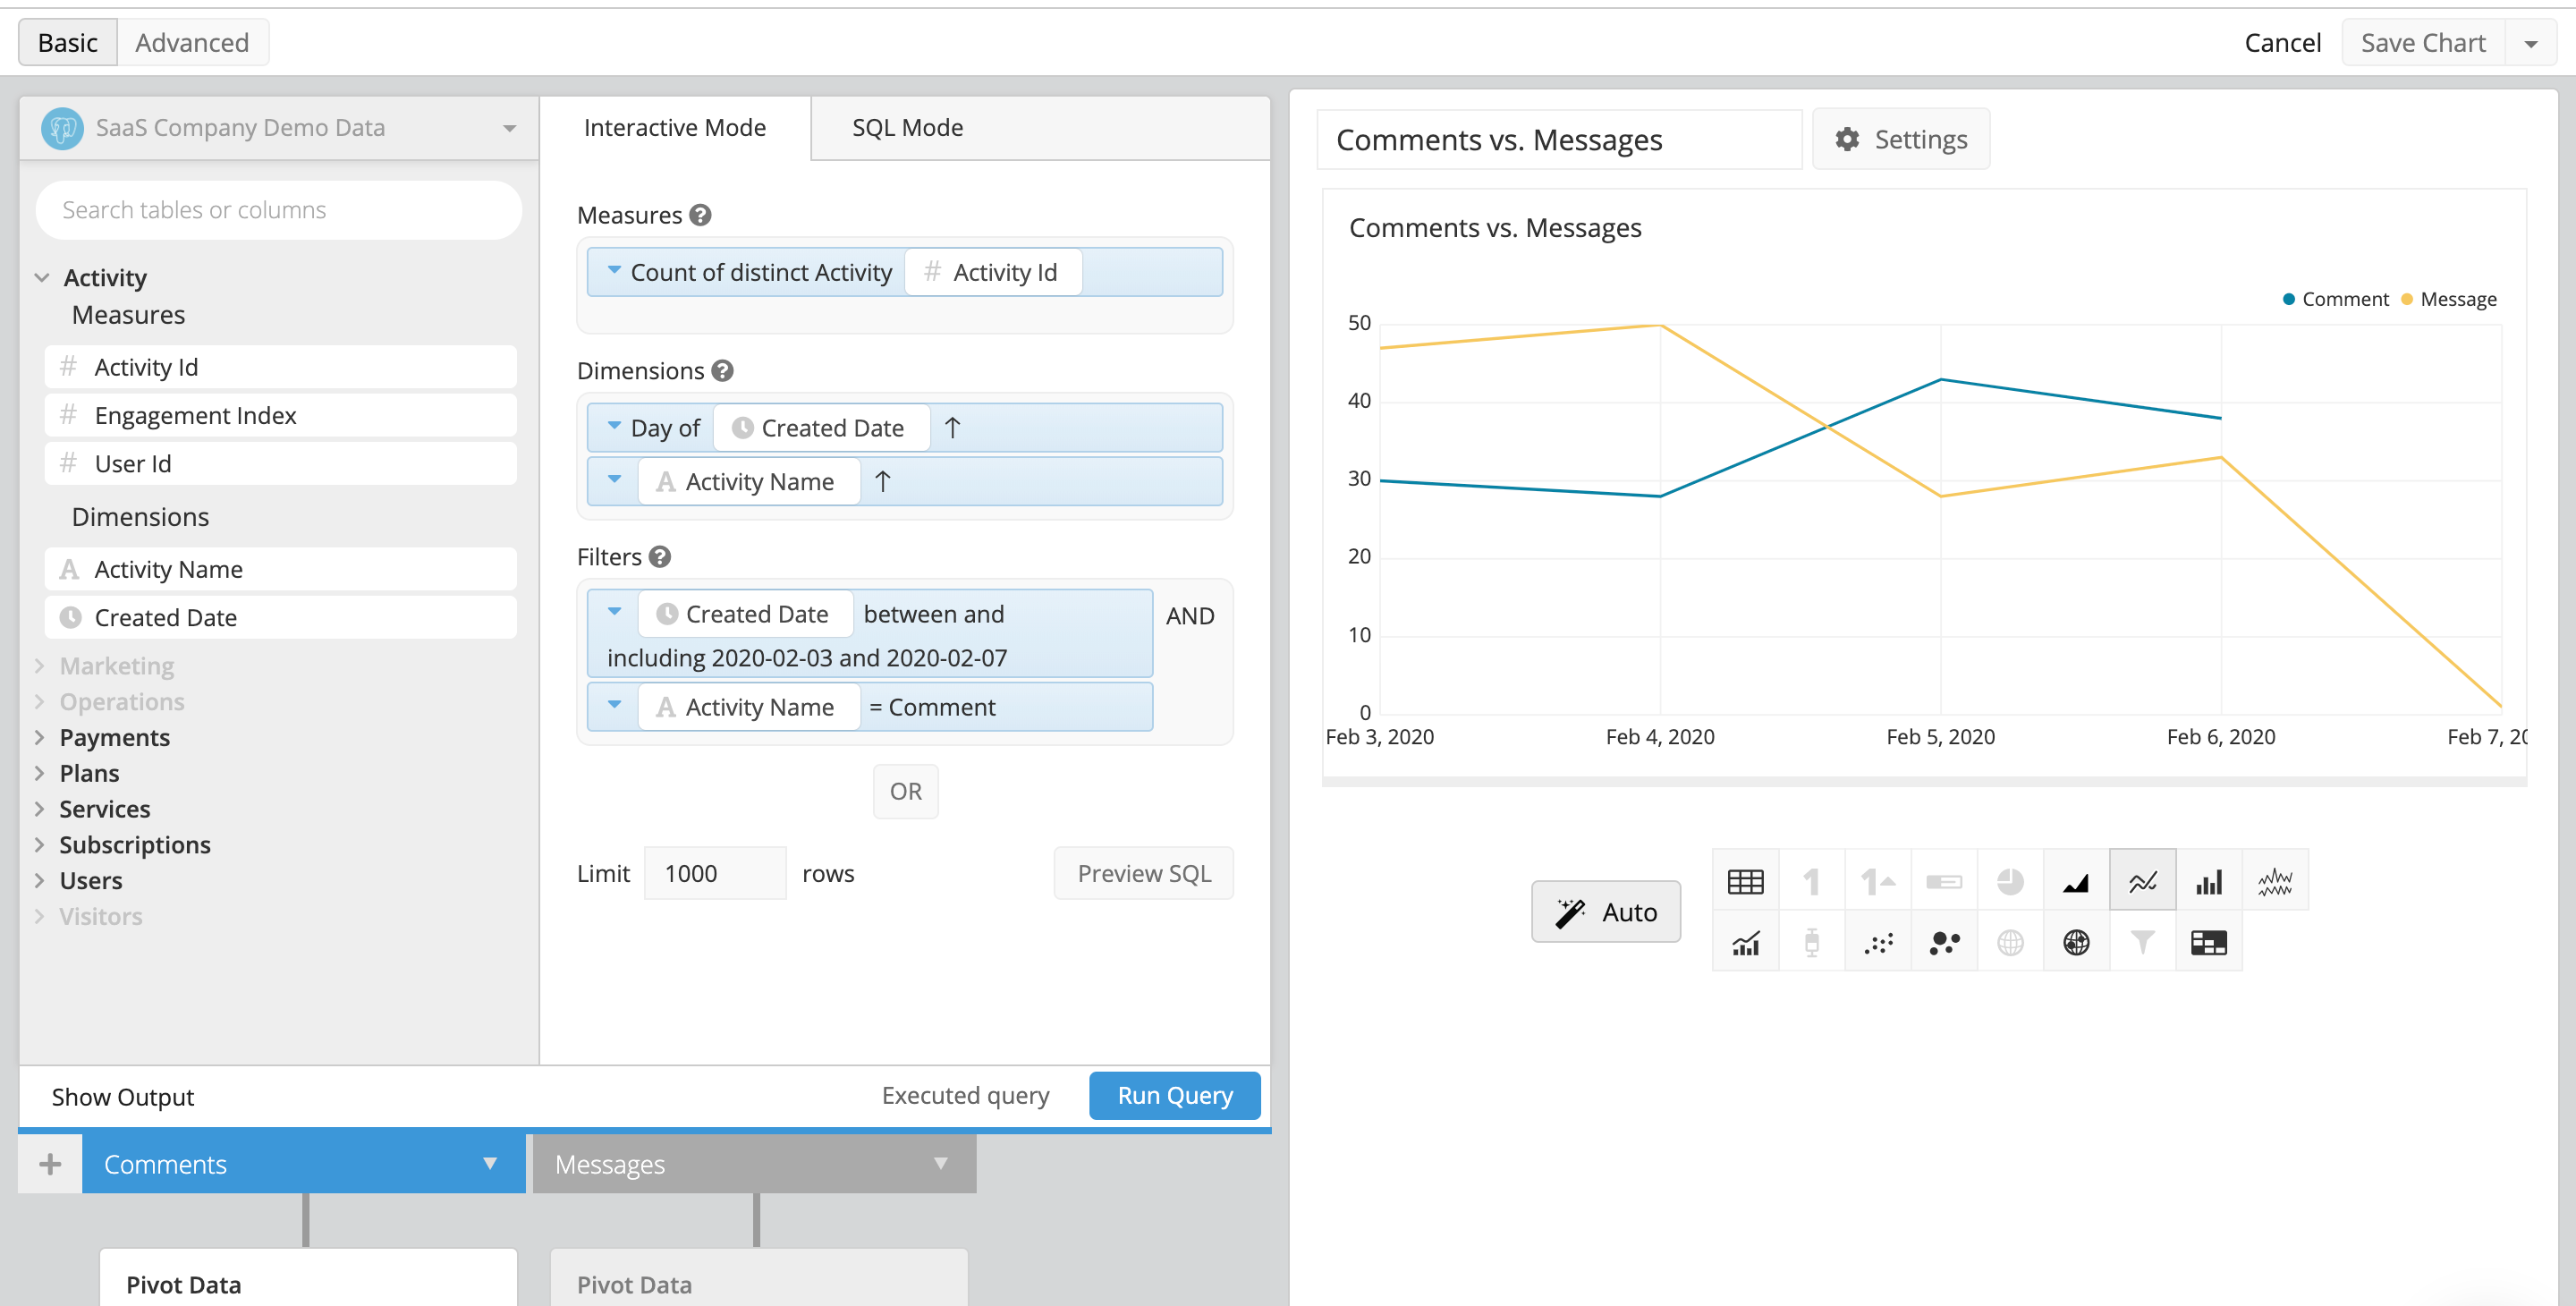
By default, the Data Explorer is opened in Basic Mode when creating new charts. When using Basic Mode, the Data Pipeline is located below the Dataset Interface, where the pipeline steps are represented as a tree.

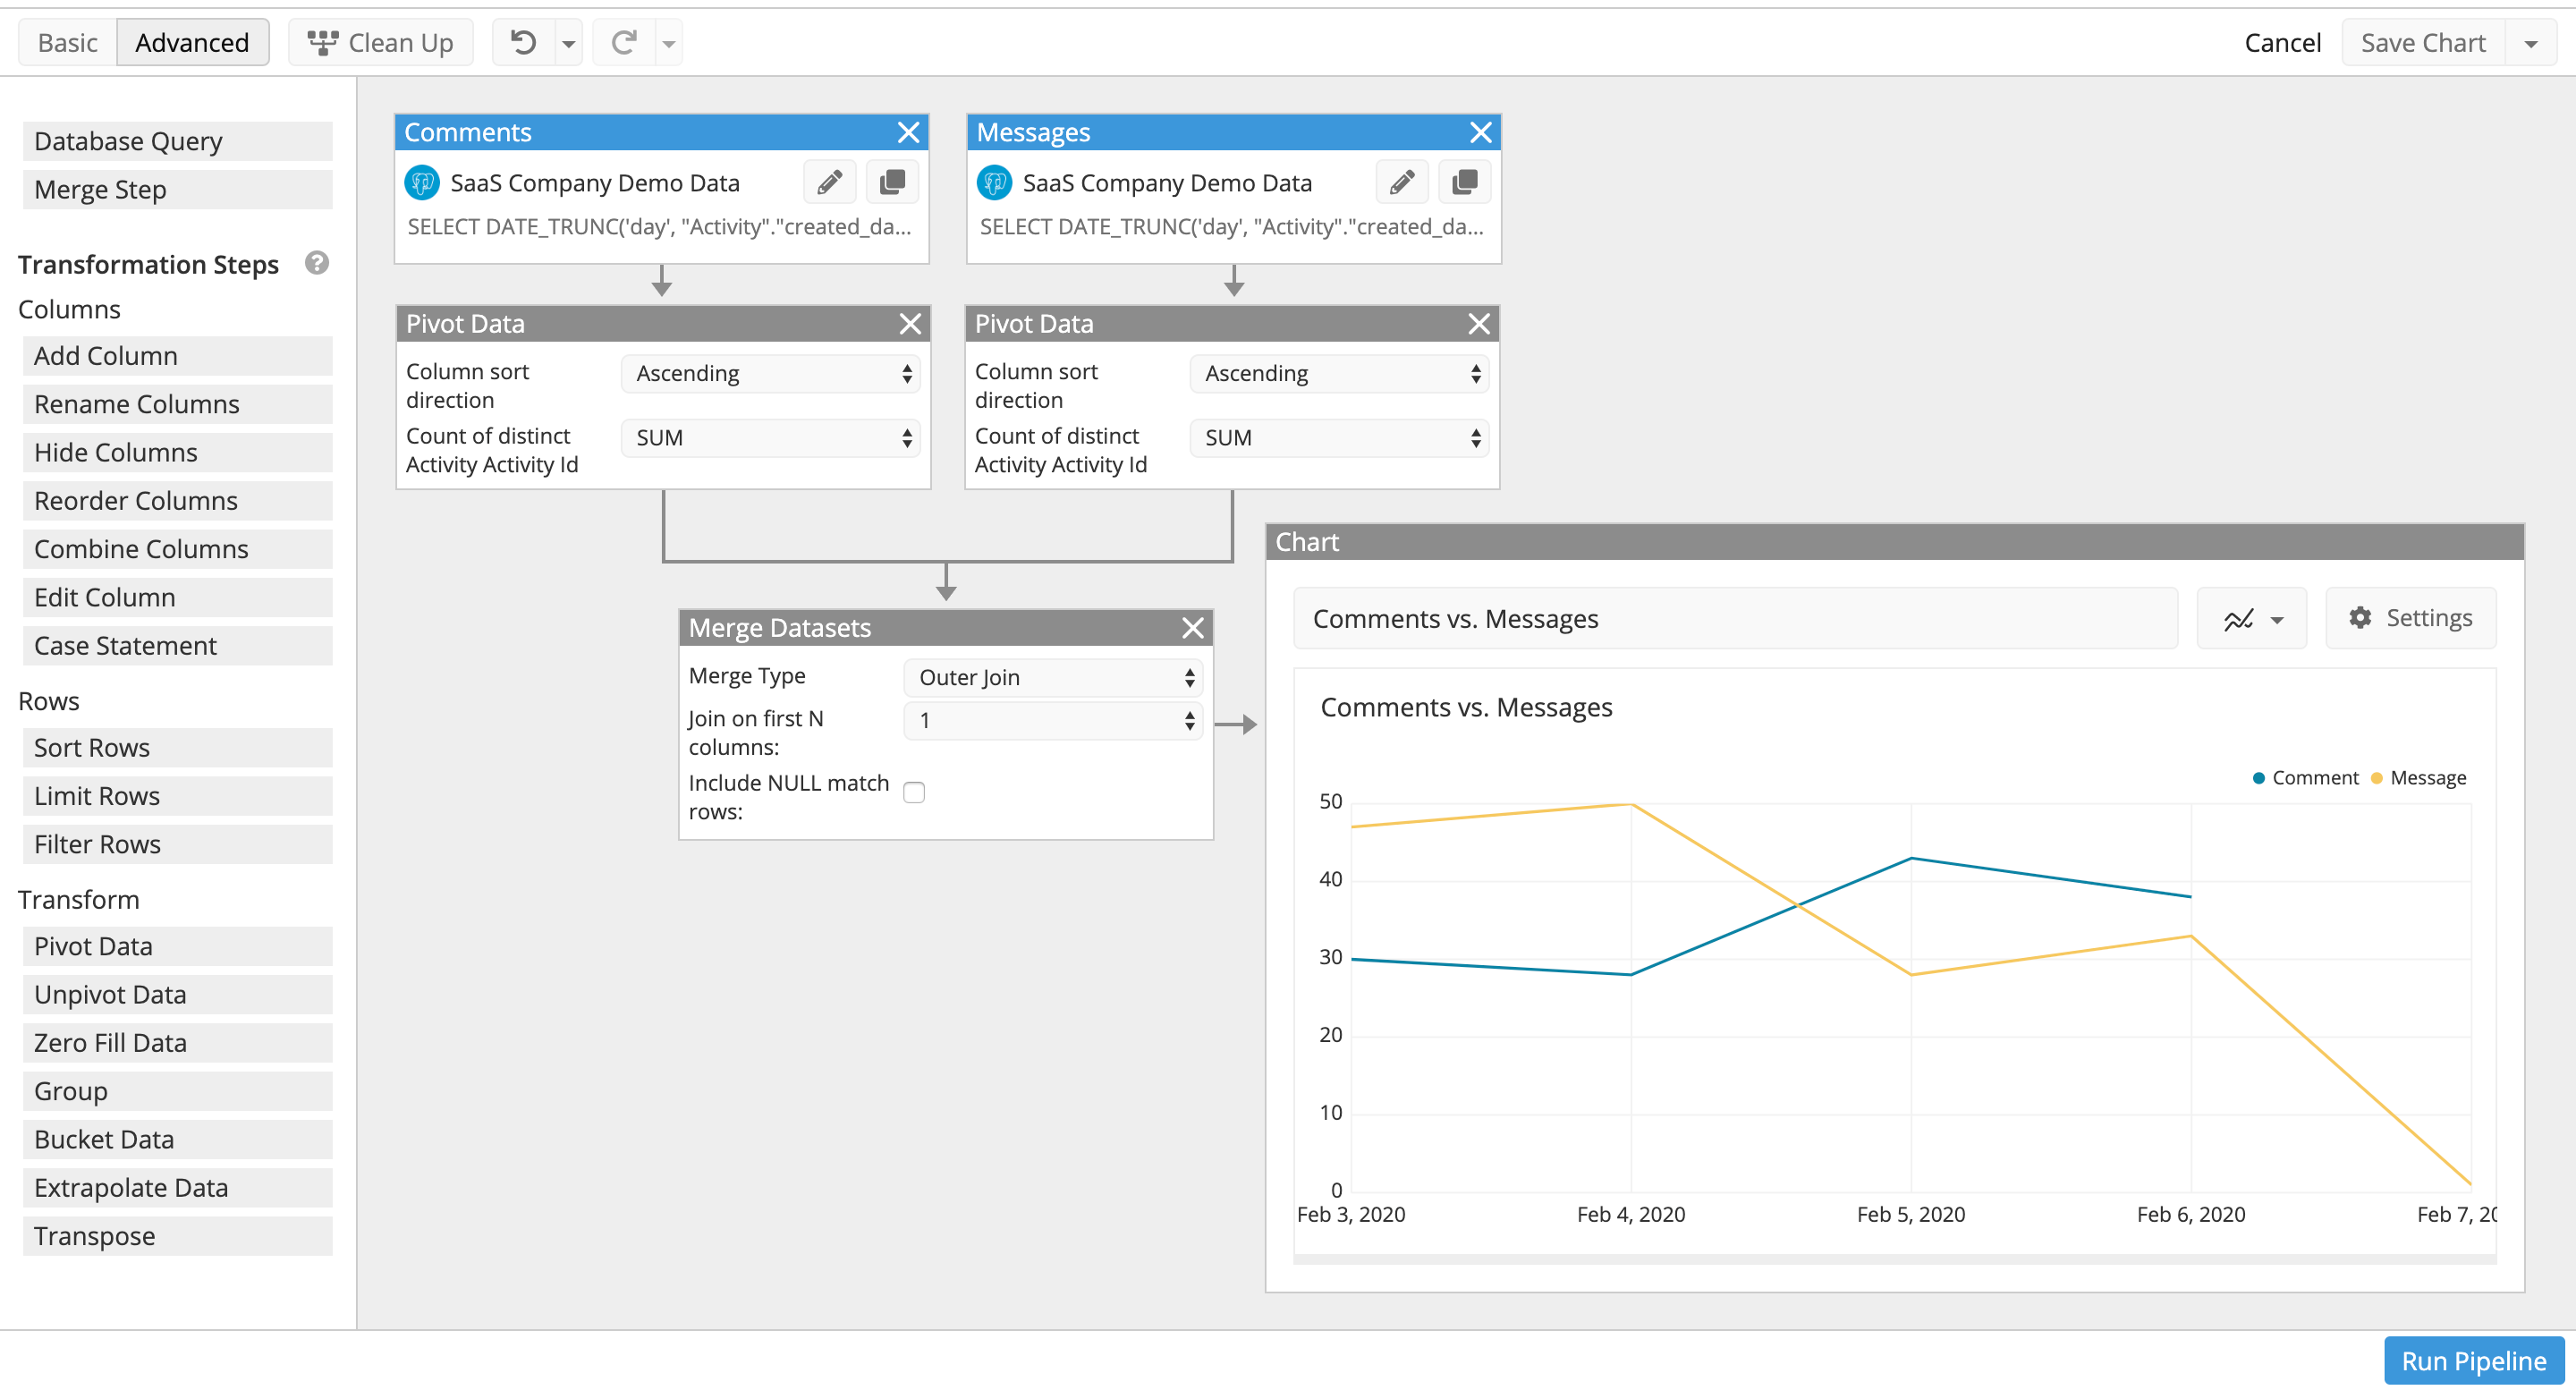
When using Advanced Mode, the Data Explorer interface changes. Every step, including queries and merges, is represented in an interactive tree of nodes. Each query, merge, and pipeline step has a corresponding node in the Advanced Data Pipeline tree that you can move around the interface.

While both views make it easy to transform and visualize your data, you may find that Advanced Mode provides some extra flexibility when transforming your datasets.