Calculate a running total in Visual SQL
A running total is a common metric to gain insight into how an amount has changed over time. This process can be easily accomplished in Chartio by using the Visual SQL Pipeline to transform your data.
First, open your existing chart or create a new chart if you do not have an existing chart to work from. At a minimum, you’ll need to include the aggregated column for which you’d like to keep a running total and at least one categorical column that will be used to group the running total. For your categorical column, we recommend using a date with a time bucket of your choice to best visualize the data you’re interested in seeing, such as month or year.
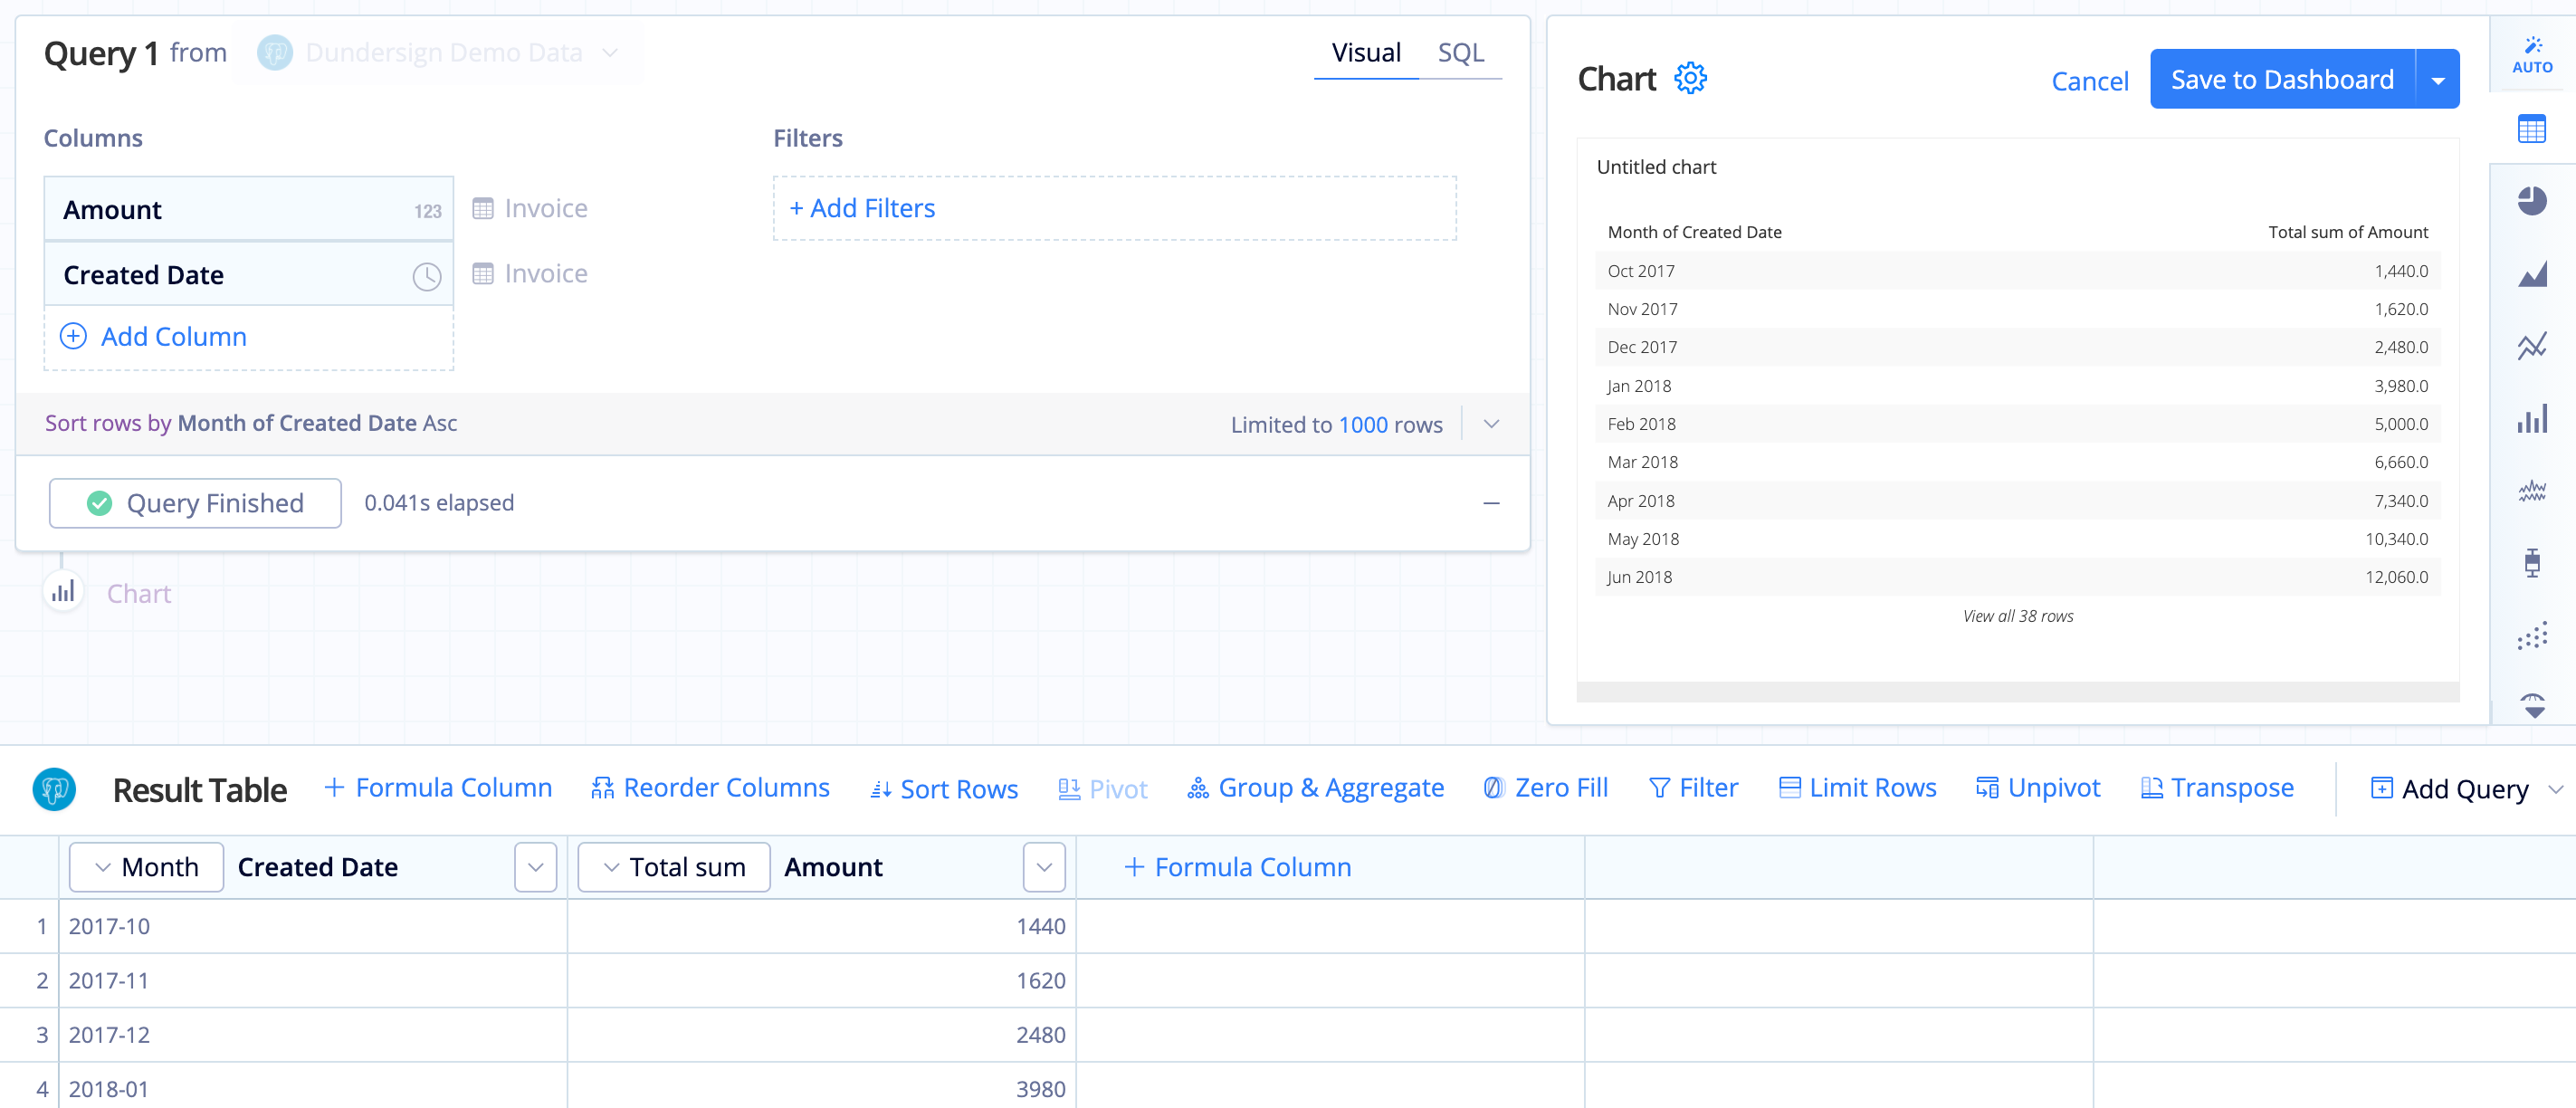
In this example, we’ll use our Dundersign Demo Data data source. From the Invoice table, we use Amount for the aggregated column, and Created Date with a Month time bucket for our grouped column. Once the columns have been added to the query, click Run Query to populate the chart.

To calculate the running total of amounts, use either an Edit Column or Formula Column (if you’d like to keep the original data as part of the chart) Action. Here, we’ll add a Formula Column.
For the formula type, select running total then select the column you’d like to be used as the input column for the running total. In this example, we’d select Amount. Click Save once completed.
To get a clearer view of how the total changes over time, change the chart type to a Line chart.
Running total by group
You can also create a running total for groups using SQLite Window Functions.
For example, we’d now like to see the amount we’ve made over time but grouped by plan type. To do this, we’ll need to use a Custom formula in our Formula Column or Apply Formula Actions.
You’ll want to use the following statement, which calculates the sum of Column1 for the groups in Column2 following the order of rows in Column3.
sum("Column1") over (partition by "Column2" order by "Column3")
To add to our first example, we also pulled in the Plan Title column from the Organizations table. We used the following statement to get the running total of the “Amount” for each type of plan “Plan”, ordered by the “Month of Created Date”.
sum("Amount") over (partition by "Plan" order by "Month of Created Date")

We can now see the running total in our table below. As we’ve added a PARTITION BY clause, the running total starts over for every new, unique value in the “Plan” column. This same formula can be used in a number of ways such as calculating the running total by month.
To better show this, we narrowed the timeframe to last 3 months of payments in the final chart:

