Relative Date Variables examples
Chartio’s Relative Date Variables allow you to generate a custom, dynamic date that can be used anywhere you would enter a date value. This convenient variable eliminates the manual process of updating a date value over time as it dynamically updates with the correct date according to the variable selected.
Relative Date Variables can be used as parts of other variables, in your queries, in the Pipeline, and even in chart titles.
Here are some examples:
- Using Relative Date Variables as filters
- Combining Relative Date functions
- Creating dynamic titles using Relative Date Variables
- Turning Relative Date Variables into timestamps
Using Relative Date Variables as filters
In this example, we create a chart to compare this week’s trials to the previous week’s using our Dundersign Demo Data data source.

In the Visual SQL interface
-
From the Organizations table, add the Id and Trial Start Date columns to the Columns section. Change the time bucket of Trial Start Date to Week from its aggregation menu. Also add the Trial Start Date column to the Filters section of the Query and use the current week filter operator.
This Query now calculates the number of trials that started this week.
Click Run Query.

-
Create a copy of Query 2. For this second Query, we want to change the date range to be the previous week instead of the current week. To do this, change the filter operator to between and including then use
{CURRENT_ISO_WEEK.START.SUB(1,'week')}for the start date and{CURRENT_ISO_WEEK.END.SUB(1,'week')}for the end date.{CURRENT_ISO_WEEK.START}and{CURRENT_ISO_WEEK.END}are Relative Date Variables, and we apply theSUB()datetime function to subtract one week from the start of the week and one week from the end of the week. As a result, we get the previous week’s data.Click Run Query.
-
Edit the Join Action below the Copy of Query 1 and change the join type to Union. Click Save to apply the join change.

-
Now, reorder the rows so the previous week is first followed by the current week. To do this, sort the rows of the Trial Start Date column to Sort rows by ascending.
-
Now you can customize your chart as needed. For this example, we found the Bar chart to be the best visualization of this data, but feel free to choose a different chart type! Click Save to Dashboard when you’re finished.
Tip! If you want your chart to display “Current Week” and “Previous Week” like this example, you can add an Apply Formula Action with the following Custom formula to automatically rename the weeks.
case when "Week of Trial Start Date" = strftime('%Y-W%W','now','+7 days') then 'Current Week' else 'Previous Week' end
Note: strftime() ISO weeks start at W00 rather than W01, so we need to add one week to the current date to account for this.
In the Data Explorer interface
- From the Organizations table…
- Drag the Id column into the Measures field
- Drag the Trial Start Date column into the Dimensions field. Change the time bucket of Trial Start Date to Week of.
- Finally, drag the Trial Start Date column into the Filters field and filter for the current week.

-
This Dataset now calculates the number of trials that started this week. For clarity, let’s rename the Dataset to Current Week.
-
Add a second Dataset to query the trials from last week. Since we’ll use the same metrics, we can simply clone our first Dataset by clicking the arrow icon to the right of the Dataset name and selecting Clone.
-
This will be the Dataset for the previous week, so go ahead and rename this Dataset to Previous Week to avoid any confusion.
-
For the Previous Week Dataset, we want to change the date range to be the previous week instead of the current week. To do this, change the filter operator to between and including then use
{CURRENT_ISO_WEEK.START.SUB(1,'week')}for the start date and{CURRENT_ISO_WEEK.END.SUB(1,'week')}for the end date.{CURRENT_ISO_WEEK.START}and{CURRENT_ISO_WEEK.END}are Relative Date Variables, and we apply theSUB()datetime function to subtract one week from the start of the week and one week from the end of the week. As a result, we get the previous week’s data.Click Run Query.

-
Click on Merge Datasets in the Data Pipeline and change the Merge type to Union. Click Apply & Close when done.

-
To reorder columns to get the previous week first followed by the current week, you’ll need to add a Pipeline Step. To do this, click the plus sign underneath the Merge Datasets step in the Pipeline and choose Sort Rows. Select the Week of Trial Start Date column and select the Ascending sort. Click Apply & Close to apply the changes.

- Now you can customize your chart as needed. For this example, we found the Bar chart to be the best visualization of this data, but feel free to choose a different chart type! Click Save Chart when you’re finished.
Tip! If you want your chart to display “Current Week” and “Previous Week” like this example, you can add an Edit Column Pipeline step with a Custom formula like below to automatically rename the weeks.
case when "Week of Trial Start Date" = strftime('%Y-W%W','now','+7 days') then 'Current Week' else 'Previous Week' end
Combining Relative Date functions
Relative Date Variables are useful when looking to filter your data on flexible date ranges. At times, they may not be as flexible as you’re looking to get. In this case, you can combine Relative Date functions within your Relative Dates.
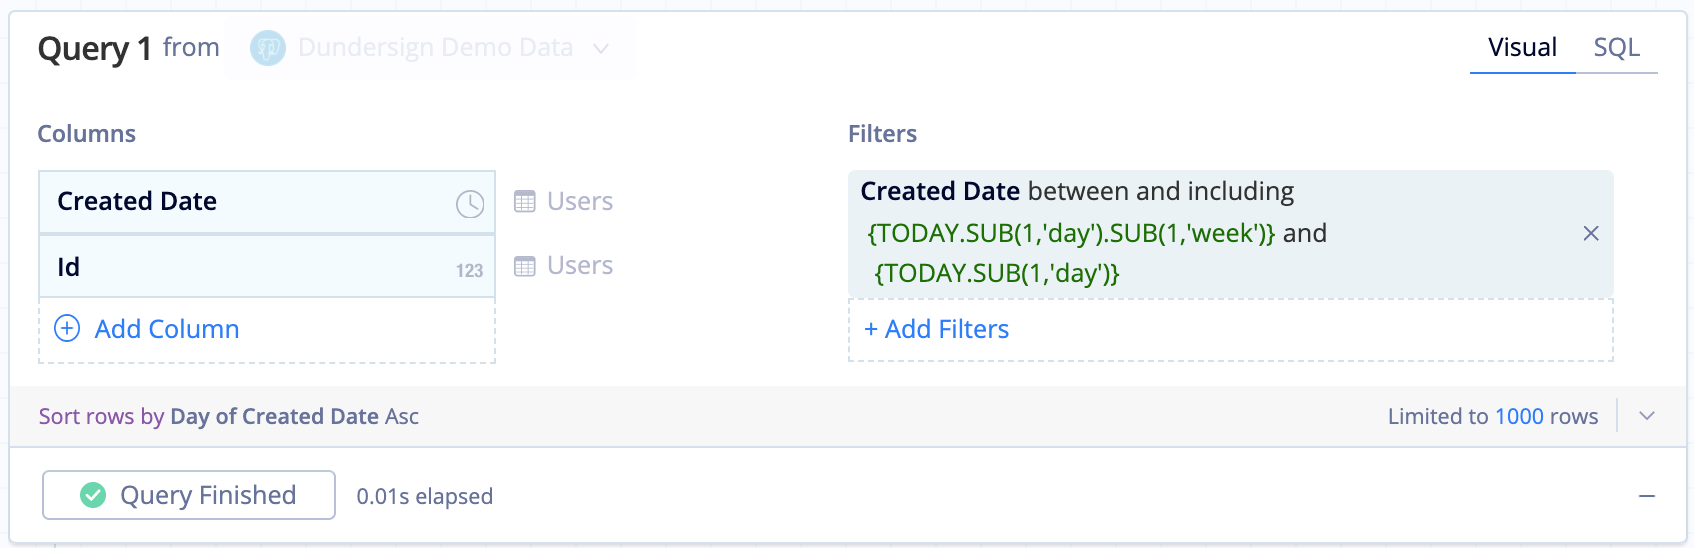
For example, what if you wanted to get data for one full week up to yesterday? You can combine these two Relative Date variables, {TODAY.SUB(1,'day')} and {TODAY.SUB(1,'week')}, into the following variable as your start date:
{TODAY.SUB(1,'day').SUB(1,'week')}
We can then use the following as the end date to get the day before today (i.e., yesterday):
{TODAY.SUB(1,'day')}
| In the Visual SQL interface |
|---|
 |
| In the Data Explorer interface |
|---|
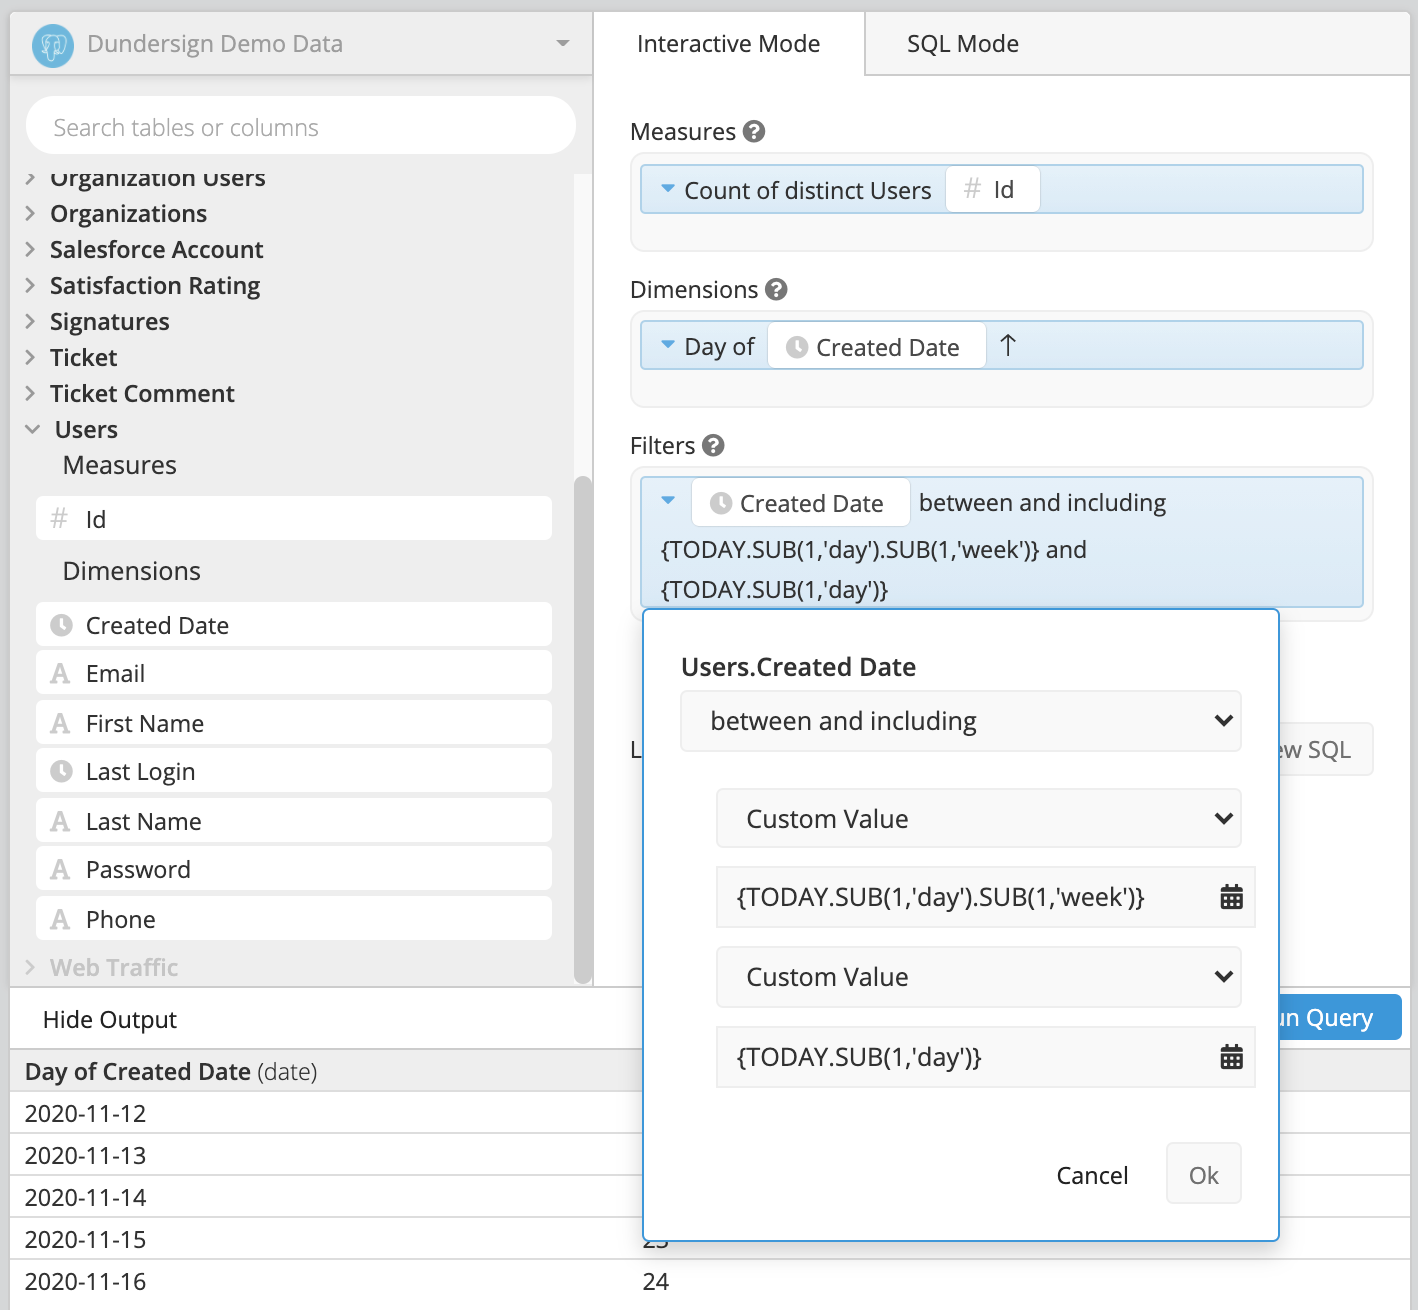 |
This gives us a date range starting from one week and 1 day up until yesterday (Nov 29, 2018).

You can combine different units with {TODAY} or with other Relative Dates as needed. The option to combine Relative Date functions is also possible using our other Relative Date Variables.
Additional information regarding Relative Dates and available datetime units can be found here: Relative Date Variable Functions.
Creating dynamic titles using Relative Date Variables
You may want your chart titles to reflect certain dynamic or changing values such as today’s date or a variable’s current value. You can do this by integrating these variables directly into your chart’s title.
For example, you could dynamically update today’s date in a chart title by using the {TODAY} variable directly in the title.
New Users: {TODAY}

It can also reflect the current value of one of your Dashboard Controls. For example, the chart below includes new users between dates selected in the Calendar Control named CALENDAR_RANGE. As the date values of the Calendar Control could change, you can use the Calendar Control date variables in the chart title so that it always reflects the correct date range.
New Users: {CALENDAR_RANGE.START} - {CALENDAR_RANGE.END}

Turning Relative Date Variables into timestamps
Relative Date Variables are, as you would guess, simply dates. If you want to use these variables to perform calculations with datetime values, you need to put them in a timestamp format. To do this, you can use a Custom formula to append ' 00:00:00' to the variable to turn it into a datetime data type. Note the necessary space in front of the 00:00:00!
For example, to turn the {TODAY} variable into a timestamp, you’d enter the following in your Custom formula:
{TODAY} || ' 00:00:00'
