Connect to Google Analytics
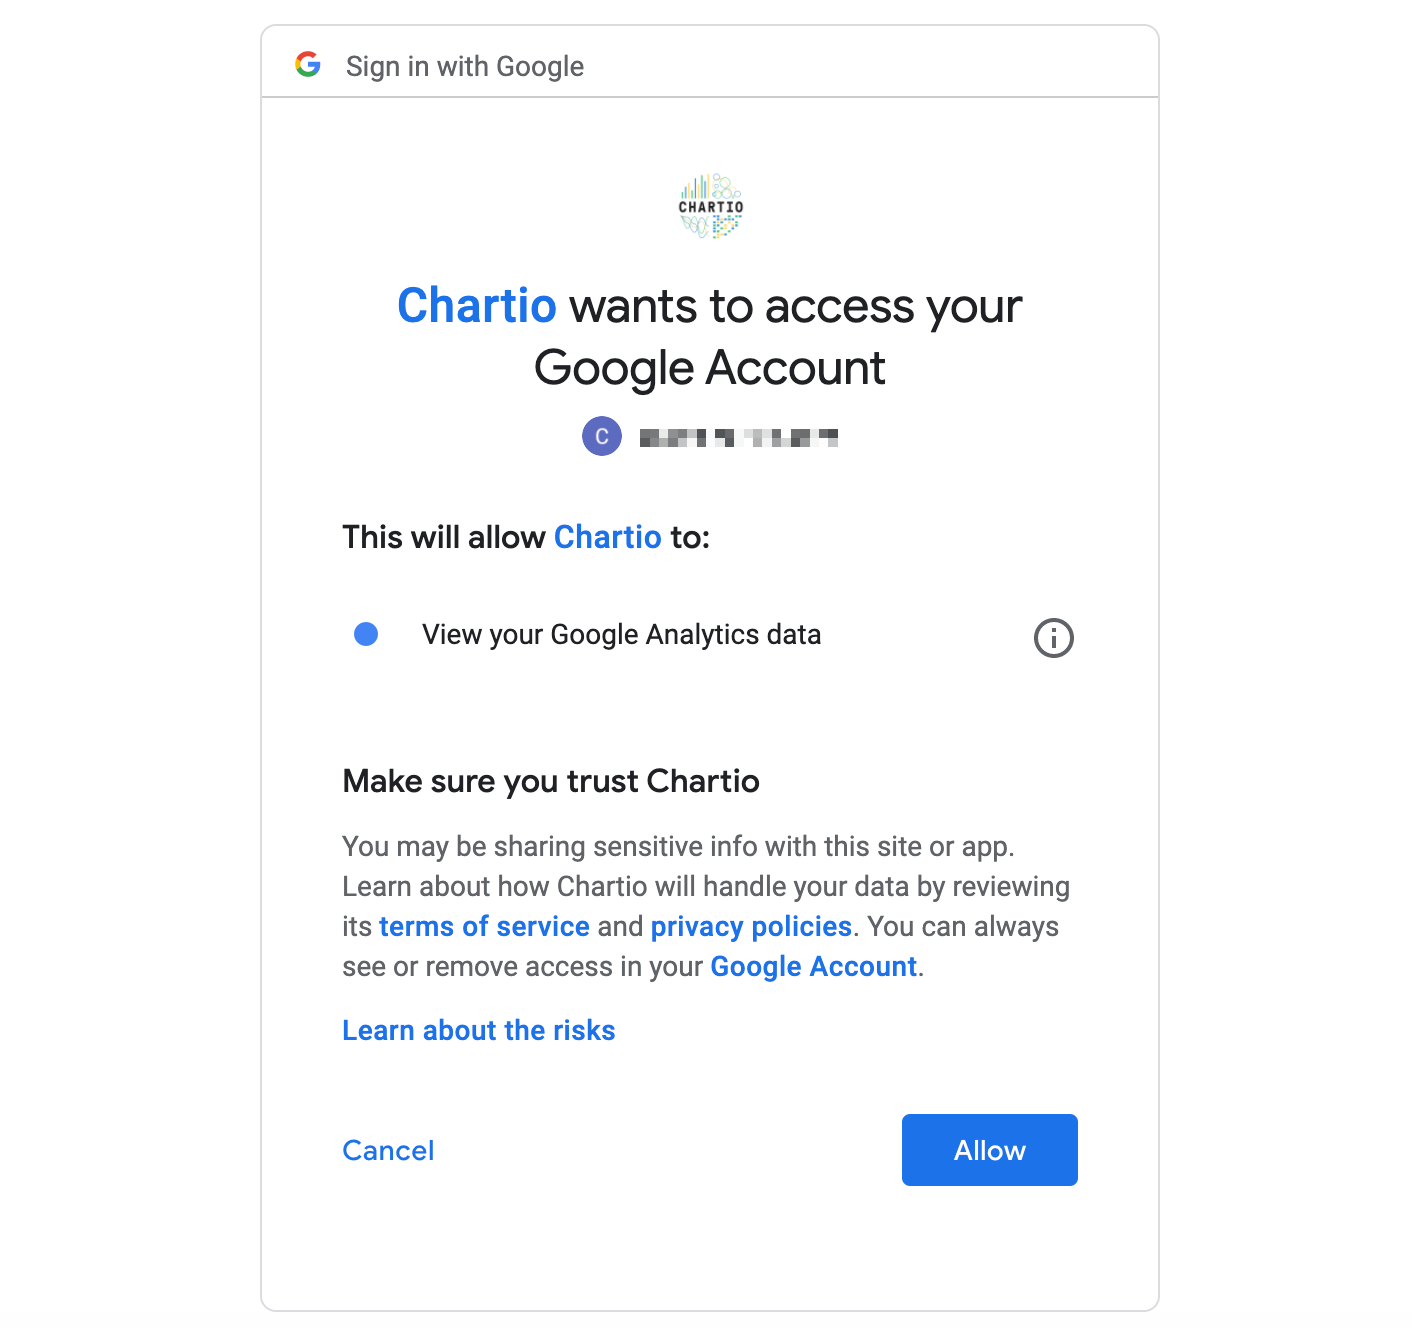
If you’re already signed into the Google account you want to associate Chartio with, you’ll be prompted with a simple permissions request to allow access. If you’re not, you’ll need to sign in to your Google account before access is allowed.
If you plan to use Google Analytics custom segments, make sure the login you use for Chartio to connect to the database has permissions to access those segments.
Once you’ve granted permission, you’ll be directed back into the Chartio interface. You can now create charts with your Google Analytics data.
Don’t see the new data source? If you return to Chartio but don’t see the new data source listed after selecting the Google account and confirming authorizations, the issue may be that Google isn’t working with your ad blocker. Please turn off any ad blocker on your browser and reconnect the Google Analytics source to Chartio.
- Google Analytics SQL syntax
- Querying metrics and dimensions
- Can’t find a metric?
- Aggregating Google Analytics data
- Querying custom segments
- Google Analytics query limit
- Renaming Google Analytics columns
- Displaying seconds in a time format
- Google Analytics sampling
- Custom Variables and Dimensions
Google Analytics SQL syntax
Google Analytics uses its own proprietary SQL, so you need to use that syntax when creating queries in SQL Mode. If you need more help, you can refer to the Google Analytics API guide and their Dimensions & Metrics Explorer.
Querying metrics and dimensions
Not all Google Analytics metrics and dimensions can be queried together. Check if a dimension and a metric combination is valid from within Google’s documentation in the Dimensions and Metrics Explorer.
For example, let’s say we want to see which metrics we can query with eventAction:
- Use the search bar to find the ga:eventAction Dimension under the Event Tracking table.
- Select the checkbox next to the Event Action item.
- Clear the search bar to bring up all the metrics and dimensions again.
-
Click Expand All to see all the metrics and dimensions you can query with ga:eventAction.
You’ll notice some metrics and dimensions are grayed out; this means you can’t query them with ga:eventAction. Any metrics or dimensions that aren’t grayed out can be queried with ga:eventAction.
Can’t find a metric?
Chartio supports querying all the dimensions and metrics available through Google Analytics Core Reporting API. You can view the API documentation for more information.
Chartio hides some lesser-used metrics by default to make your data easier to navigate. If you can’t find a column, please see our instructions for unhiding metrics in your schema.

Aggregating Google Analytics data
The Google Analytics API only allows querying directly for dimensions and metrics and does not allow Chartio to perform aggregations on the data.
Many Google Analytics metrics are already aggregated. For example, Sessions is a count of sessions and Visitors is a count of visitors.
If you’d like to apply aggregations on top of Google Analytics metrics, such as average of Sessions, you can do so with Visual SQL Actions or in Data Explorer’s Data Pipeline.
For definitions of individuals metrics, see Google’s Dimensions & Metrics Explorer.
Querying custom segments
You can use Google Analytics custom segments in SQL Mode.
First, go to the Google Analytics Query Explorer and log in to your Google Analytics account. Select your Property and View, and find your segment in the segment dropdown list.

Once you find your segment from the dropdown, you’ll see its segment ID below its description. It’ll look something like gaid::-2.
You’ll need to use SQL Mode to include a custom segment, but we recommend building your chart in Interactive Mode first if you aren’t familiar with the Google Analytics querying language.
Once you have all your dimensions and measures set up in Interactive Mode, switch to SQL Mode. Follow the format in the example below to insert your custom segment filter; add all the bolded lines, replacing the segment ID with your own.
"dateRanges":
- "endDate": "{TODAY}"
  "startDate": "2010-12-18"
"segments":
- "segmentId": "gaid::-2"
"dimensions":
- "name": "ga:date"
- "name": "ga:segment"
"includeEmptyRows": !!bool "true"
"metrics":
- "expression": "ga:sessions"
"pageSize": !!int "1000"
"post-process": "date"
In summary:
- Find the custom segment id via Google’s Query Explorer, if you don’t have it already.
- Build the query in Interactive Mode in Chartio.
- Switch to SQL Mode, add “segments” header with segment Id, following the syntax in the example above.
- Add ga:segment under dimensions following the syntax in the example above.
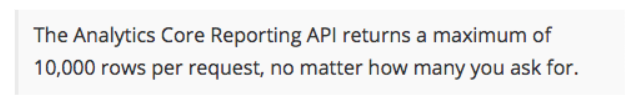
Google Analytics query limit
Google Analytics enforces a 10,000 row limit on all queries. This is a Google Analytics limit, not a Chartio limit.
If you want to query past the limit applied to Google Analytics queries, you can use multiple Datasets. Using a Union join type to merge multiple Datasets in Chartio, you can extract up to 100,000 rows.
See the Reporting API guide for more information on the Google Analytics limit.
Renaming Google Analytics columns
The Google Analytics API doesn’t allow for renaming columns in the query itself. However, you can rename the columns in the Pipeline after executing the initial query:
- Rename Column Action in Visual SQL
- Rename Columns step in Data Explorer
Note: If you’re using the column name in any Formulas (Visual SQL or Data Explorer) in the Pipeline, make sure you’re using the new column name if the Formula occurs after the Rename Column step. If you’ve already referenced the column using its original name in the Pipeline, simply add the Rename Column step at the end of the Pipeline.
Displaying seconds in a time format
In order to display seconds in a time format—for example, to be able to see the average time per page from Google Analytics—add the following depending on your chart editor interface:
- Visual SQL: Formula Column or Apply Formula Action
- Data Explorer: Add Column or Edit Column step in the Pipeline
Choose Custom Formula and type in the following in the Formula field:
strftime('%H:%M:%f', "ga:avgTimeOnPage" ,'unixepoch')
replacing ga:avgTimeOnPage with the name of your datetime column.
Google Analytics sampling
You may find inconstancies with Google Analytics data in Chartio. The main reason for this is the fact that Google Analytics samples their data (See Google documentation on data sampling for more information). Depending on what Google Analytics account you have, you may be limited to sampled data. Only the premium accounts support unsampled data.
Click here for Google Analytics account info.
However, the numbers should still be fairly close - sampling is meant to give you a close approximation.
It seems that the sample data is fairly accurate when it comes to visits and page views but it can vary in a wide range for revenue, transactions, and goal conversions. In one of the tests from the articles below, they found revenue could be off by 11% to 80%.
There’s a number of articles available by a quick Google search. Here are a couple articles that could be helpful:
- Can you trust your Google Analytics data?
- Data Sampling in Google Analytics: How It Works, Why It Matters, and What to Do About It
To get unsampled data for your team, you’d be required to have a Google Analytics Premium account and BigQuery.
We currently use Google’s Core Reporting API V4. You may be able to return more accurate results by using:
"samplingLevel": "LARGE"
More information can be found in Google’s Reporting API V4 documentation.
Additionally, you may be able to pull unsampled data using various other techniques, such as the following: Pull More than 10k rows Unsampled using Google Analytics Sheets Add-on.
Custom Variables and Dimensions
They can all be accessed from Chartio via SQL mode, but if you’d like to view all the columns in the schema browser, please contact us at support@chartio.com to enable the additional custom variables and dimensions.