Show All setting for Dashboard Controls
When you set a Dropdown Control in a Chartio dashboard to Show All on the empty state, you’re telling the chart’s query to apply a filter of WHERE 1 = 1. You’re ultimately telling the chart’s query not to filter anything.
Check out our other FAQ if you’re looking to filter your chart with all values in the Dropdown when no values are selected.
In this example, we created a Dropdown Control by clicking Add Control > Dropdown from the dashboard sidebar. In the Control settings, we select Multi-select and Show All for the Empty State.
This example filters a subset of marketing campaigns we’re tracking in our data source that have happened within the specified date range.
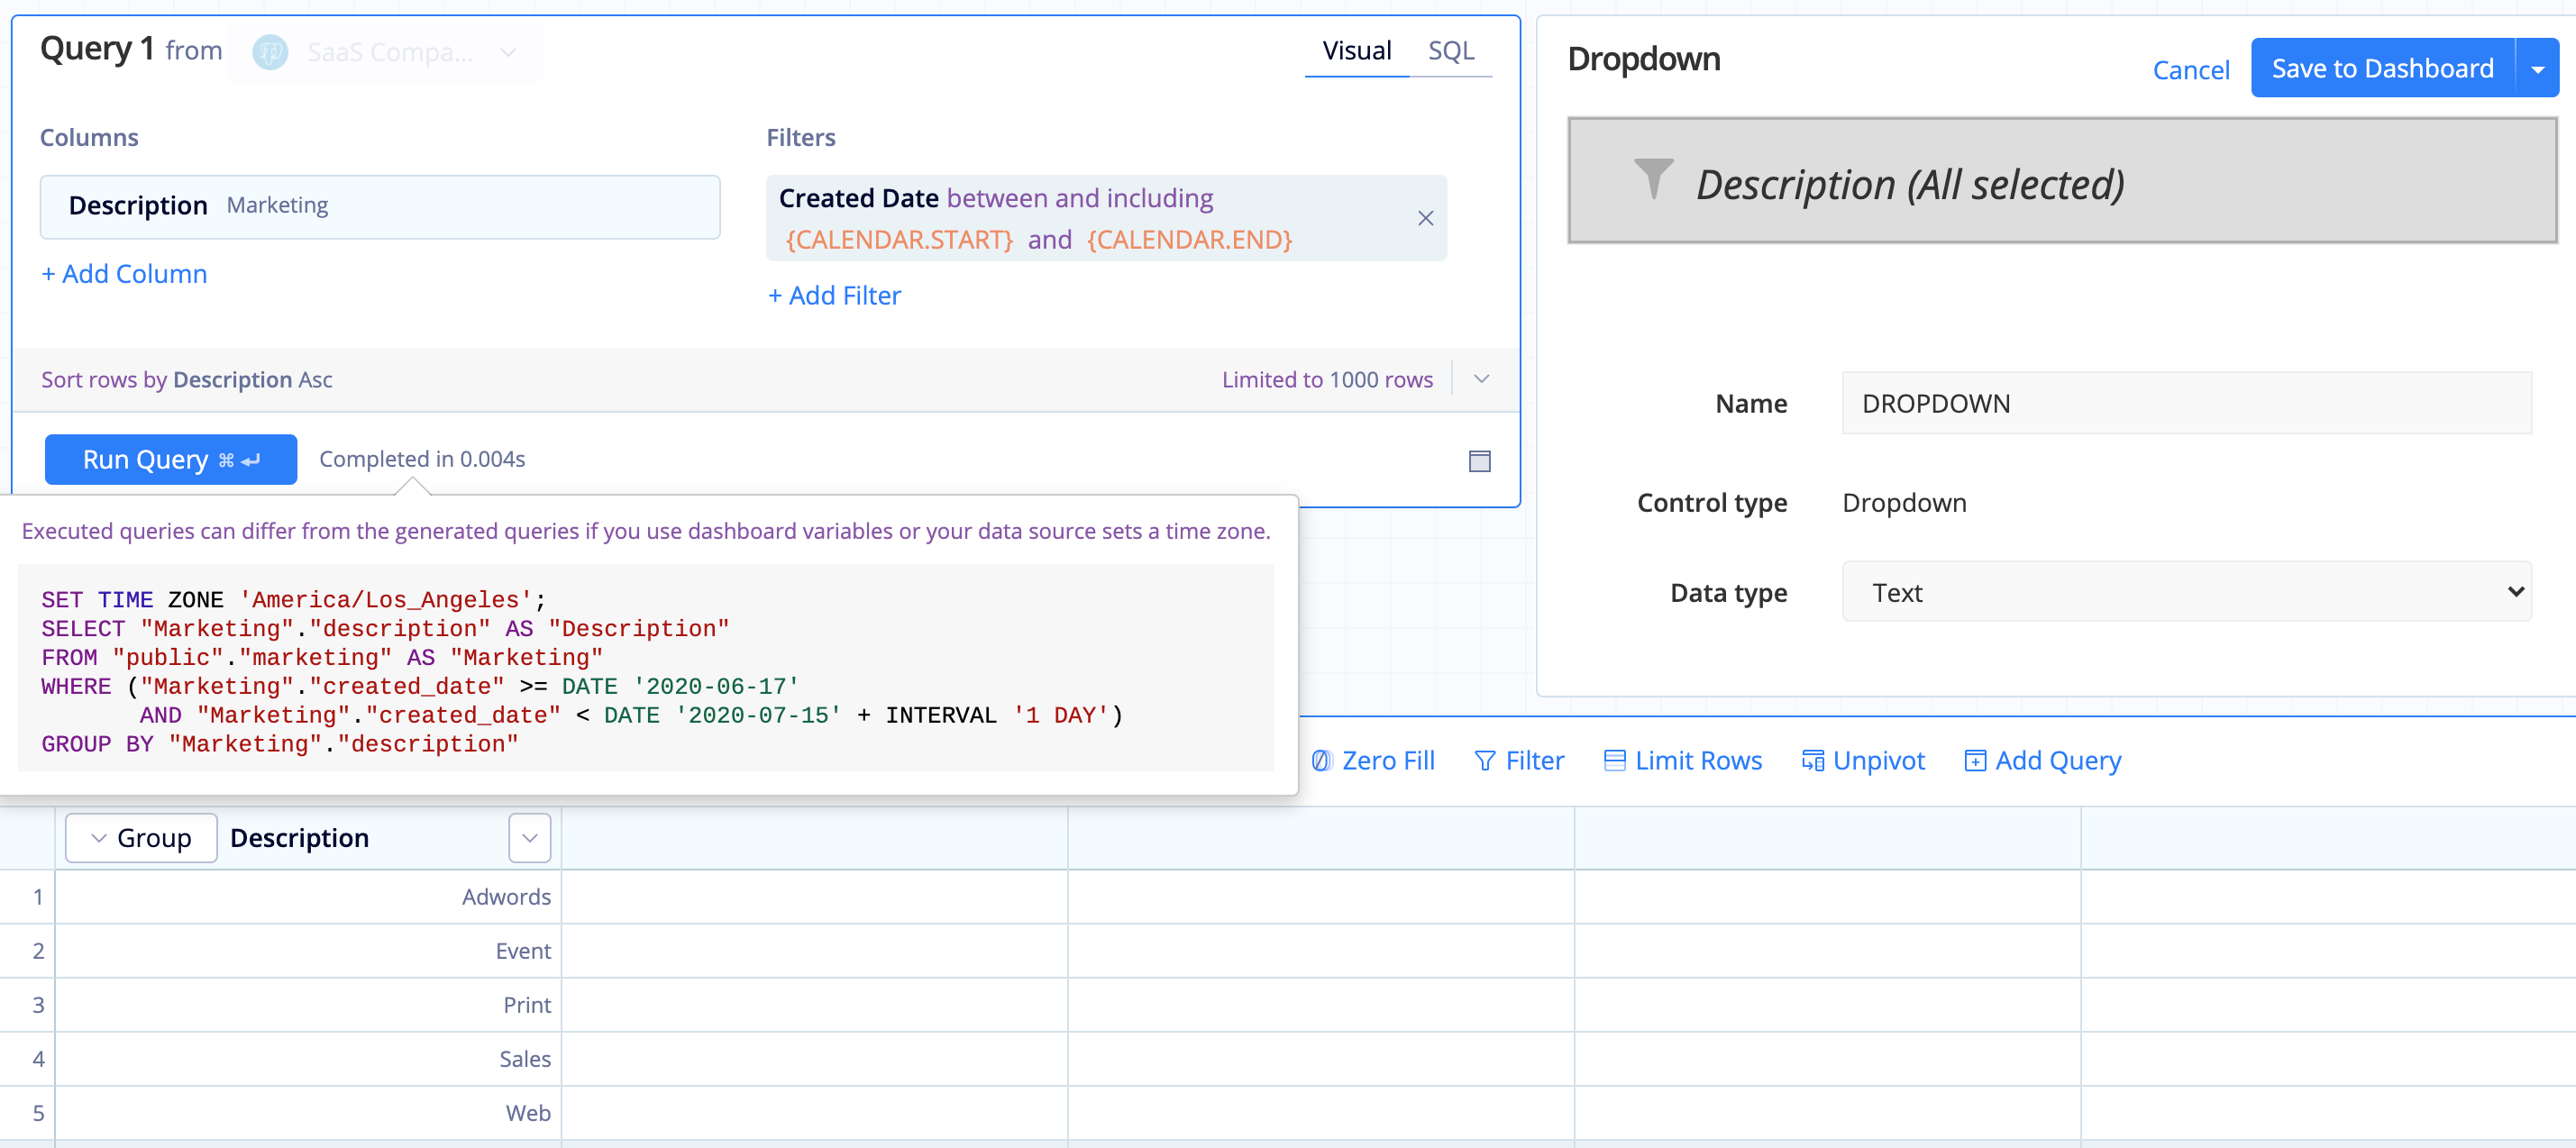
| In the Visual SQL interface |
|---|
 |
| In the Data Explorer interface |
|---|
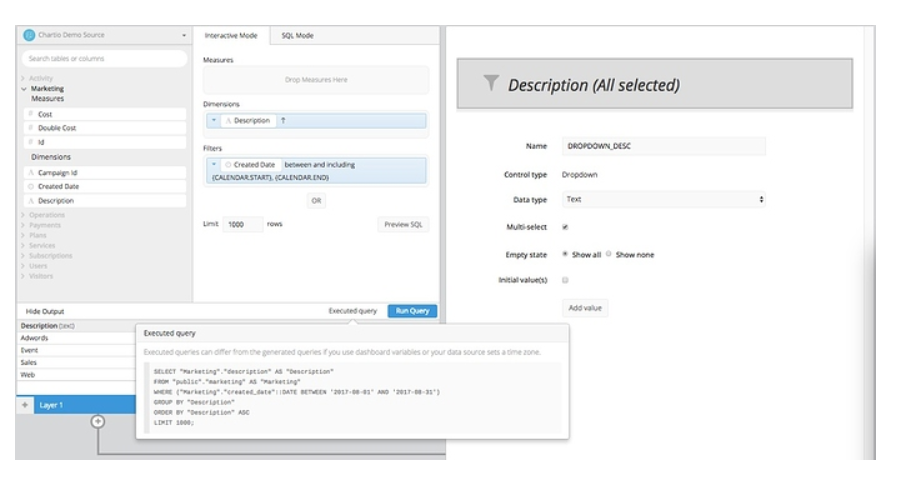 |
If we connect this Dropdown to a chart, we can analyze what’s happening in the chart’s query. To see the SQL query Chartio has written on the backend, do the following:
- In Visual SQL, run the query then click the Completed in X s link next to the Run Query button.
- In Data Explorer, run the query then click the Executed query link next to the Run Query button.
The query is sending where 1=1 into the WHERE clause:
select "Marketing"."description" as "Description", sum("Marketing"."cost") as "Total sum of Cost"
from "public"."marketing" as "Marketing"
where (1 = 1)
group by "Description"
order by "Description" asc
limit 1000;
It’s basically telling the chart, “Don’t filter anything yet; we haven’t selected anything from our Dropdown.” Once, we start selecting values from our Dropdown, the executed query begins to look different from the prior SQL query. This is because the query begins to filter on our marketing campaign values. In the SQL statement above, we show the filtering of more than one value; ‘Event’, ‘Adwords’, ‘Web’, and ‘Sales’. We have the ability to choose more than one value in our Dropdown because we selected the option to multi-select when the Dropdown was first created:
select "Marketing"."description" as "Description", sum("Marketing"."cost") as "Total sum of Cost"
from "public"."marketing" as "Marketing"
where ("Marketing"."description" in ('Event', 'Adwords', 'Web', 'Sales'))
group by "Description"
order by "Description" asc
limit 1000;
The issue is that when “Show All” is selected, the query is not passing through all the items; instead, the chart does not filter anything.