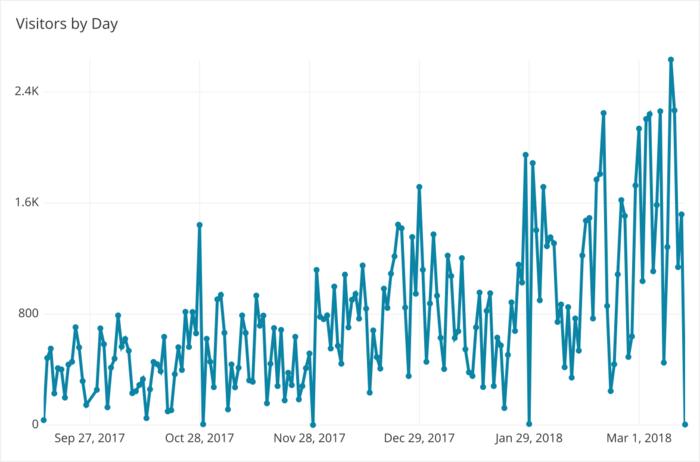
Knowing the running total of visits or users or activities over a rolling time period is a good way to analyze your website or app’s performance. The search term “12 Month Rolling report” has over 12 million search results, and experts believe the rolling report is one of the best ways to show trends. Substituting your time period for an annual or 12 month view, depending on your use case, is just as insightful.
For example, analyzing daily website visitor trends over a six month time period can show valuable information, but it does not show trends over smaller time periods within the chart’s scope. It will only show the overall trend.

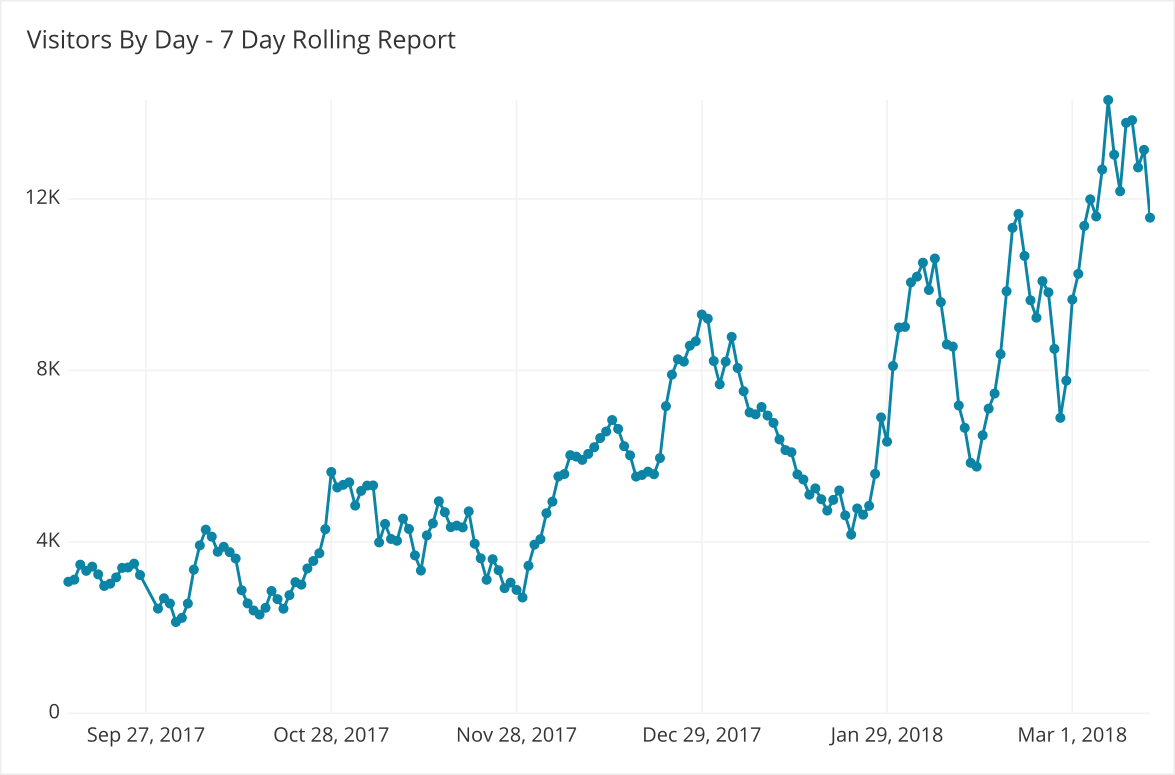
If you are looking to get insights to identify periods of growth or decline a rolling trend analysis can help you identify these periods. The chart below shows the same data seen above, arrayed on a daily interval, in a rolling 7 Day trend format.

With this 7 Day Period Rolling View you can see more than just the overall trend seen in the daily total line chart. Here you can see micro-trends within the overall experience which can reveal much more insightful information for your organization. In our example here we can see the overall trend of visitors by day is up in our first chart, but our second reveals consecutive 7 periods within our overall trend that have a downward direction. This kind of insight can help us identify periods of downward trend that might coincide with marketing efforts that either worked, or didn’t.
The Query
To build this query we will want to know a few things:
- The rolling period. Example 12 month, 30 Day, or 7 Day. In our case: 7 Days.
- The metric we are analyzing: visitors per day.
The query will be composed of different subqueries. First, use generate_series to assign rows in a table for all dates in a date span from the beginning to the end of the date span in the visitors.created_date column, which will be called upon in the main SELECT statement. This subquery will serve as the table we’ll select from.
A second subquery will go in the main section and return the count of all of the unique visitors that visited our site in a 7 day period. This subquery will serve as its own column in the main query, and will count the distinct visitors from the “day” to 7 days prior to the “day”.
Putting it all together, we can generate a rolling trend of our Visitor per Day in a 7 Day period:
    SELECT
        day,
        (
          SELECT
              COUNT(DISTINCT "Visitors"."visitor_id") AS "Visitors"
          FROM
              "public"."visitors" AS "Visitors"
          WHERE
              "Visitors"."created_date" BETWEEN b.day - 7 AND b.day + 1
        )
    FROM  (SELECT
            generate_series(
                            MIN(DATE_TRUNC('day', "Visitors"."created_date")::DATE),
                            MAX(DATE_TRUNC('day', "Visitors"."created_date")::DATE),
                            '1d')::date as day
            FROM "public"."visitors" AS "Visitors"
          ) as b
    GROUP BY day
    ORDER BY day
Testing the math. We can test the math here in the following table. See the lag steps that assigns the prior 7 days to the Count column, and the total column that will equal the Visitors Column.

With our math confirmed, we can trust this function to give us an overall view of running totals of rolling periods. The above query can be adjusted to show different time periods depending on your use case.