Off The Charts: An Interview with Anita Lillie from LinkedIn
Posted by dave on April 16, 2012 Off The Charts
Anita Lillie is a data visualization designer at LinkedIn. Before LinkedIn, she spent time at the Nokia Research Center in Palo Alto for the Data Insight group. Her masters thesis work at the MIT Media Lab (in the Hyperinstruments group) looks at music as data in order to create maps of music libraries. I had the opportunity to sit down and speak with her about her work and her thoughts about the world of data visualization.
If you took a snapshot of the data visualization industry right now, what would you see?
It’s both an exciting time and a dangerous time.
It’s exciting because there’s so much more data than ever before: people are becoming more open and engaged with data, storage is getting cheaper, and we’re realizing more of the value of data than we have in the past. With all this information, our biggest challenge is to make sense of it all. A whole group of data scientists, designers and other data professionals sit atop this flood of information, and we enjoy the challenge of helping our users derive insights from that data. And our users love it, people are definitely excited about data and paying attention to it in unprecedented ways.
However, with this profusion of data and demand comes the responsibility to ensure we are helping users make real insights and have the appropriate context for interpreting that data. Infographics are a great way to make data easily digestible to a broad audience, but the challenge is in making sure we don’t simplify the data representation to the point that some meaning is lost.
So what are some of the core challenges with infographics?
The tricky thing is striking the right balance between data clarity and visual appeal. Of course it’s hugely important to have a visualization be beautiful. Achieving beauty is the way to get anyone to sit down and pay attention to what your visualization has to convey. But a beautiful visualization also needs to guide users through the next step just as well as it got their attention. It should be clear about what can be uncovered in the data and why it matters.
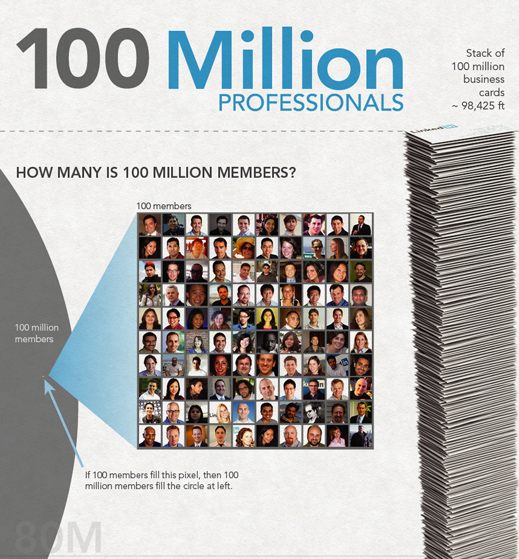
We should strive to tackle ideas in data and show data that clearly supports those ideas and hypotheses. For example, when I was working on the infographic to commemorate LinkedIn surpassing 100M users, I struggled to try to find a metaphor to describe exactly how big 100 Million members is. At that scale, numbers simply evade human comprehension. Ultimately I chose to challenge the user to think about squeezing a hundred members into a pixel, and then show how big an area 100 million members would cover at that scale. From there, we try to explain in more detail what those members look like.
So tell me a bit about what other kinds of design you helped with at LinkedIn?
LinkedIn is basically built on top of data. Every single page is a visualization of data, and we’re constantly looking for more ways to surface insights for our users - about their skills, their connections, so they can make their jobs and careers even better. So I spend a lot of time consulting with designers, data scientists, and product managers to develop new products that illuminate our user data.
What’s the most challenging work you’ve had to do? Have you ever found data that simply defies visualization?
The most challenging (and most fun!) work I do is when we have data that doesn’t have a “solved” or accepted way to display it.
What’s an example of that?
One of the places we’ve tackled this kind of challenge is in our LinkedIn Skills product. Skills are connected to each other because any given person has more than one skill, and those skills are often related in some way. So we want to create an interface where our users can explore the world of skills, browsing for skills related to their own, and be able to target new skills they’d like to acquire, or outdated skills they might want to shift away from.
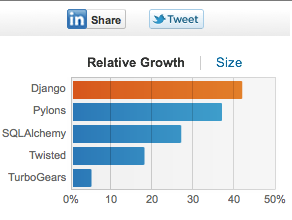
Let’s say I’m interested in Django programming. We’re able to show you how quickly Django is growing, how many people know Django, and more details about skills and companies related to Django.
I also want to go beyond this and help users see the broader landscape of skills, get a better sense of skill lifetimes, and learn what skills are necessary to move into their dream job.
Before you joined LinkedIn, you did a really cool project around visualizing music for MIT Media Lab. Can you tell me a bit about that?
MusicBox is my attempt to create a more intuitive music browser. As an avid music fan, I struggled as the size of my library outgrew my ability to remember names of tracks and artists. I couldn’t find “that one song”, or easily create playlists for particular moments. So I built a browser that shows your library as one big map which displays every song as a dot on the map whose location depends on what it sounds like relative to the other songs in your library. I threw lots of the textual metadata out the window and showed a visual instead. You can, for example, find that one Run DMC song and the 100 songs that sound most like it, or the 100 songs that sound nothing like it.
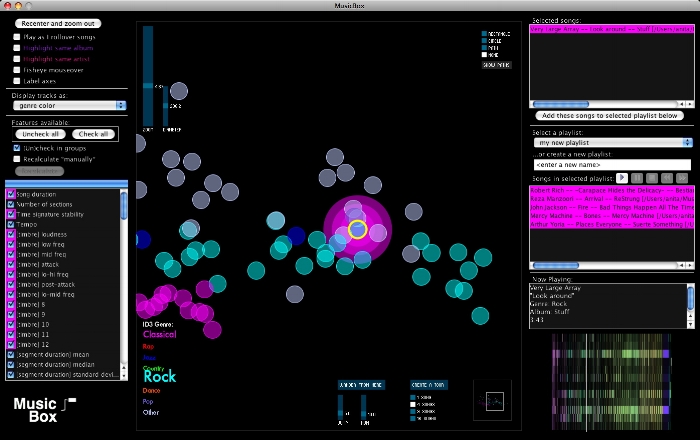
One problem it also helped to solve was that of incomplete or dissatisfying metadata. Sometimes I’d have songs that didn’t have a genre assigned, or which didn’t seem to actually fit into the genre assigned. MusicBox shows songs in areas of the map, which in turn become something like new genres except that they are organized based on the quality of the sounds (pitch, timbre, etc.) instead of the metadata a record label decided was appropriate. A song classified by your current browser as “Rock” might actually be better described as “Country” based on the quality of the sounds themselves.
MusicBox also makes it easier to make playlists. You can create playlists of similar music by selecting a region on the map, or you can create playlists of music that transition from genre to genre by drawing a path through the space. Or you can randomly walk through the space, creating a sort of “smart shuffle” that minimizes the auditory transition between tracks while still giving you a diversity of sounds overall.
What was something unexpected you found through the visualization?
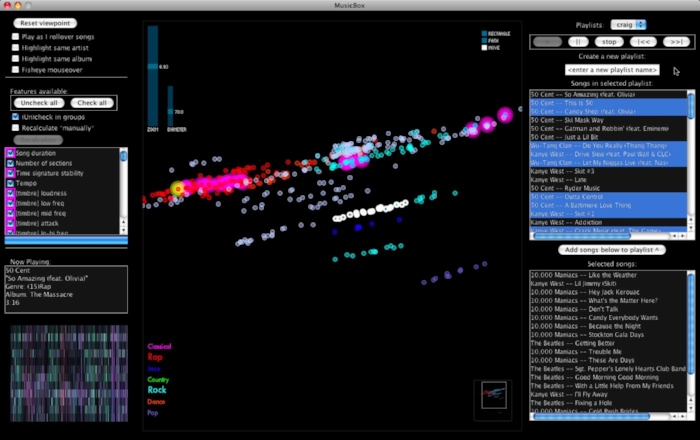
Take the band Wilco for example. They’re usually classified as alternative rock. But what does “alternative rock” really mean? When I started assigning quantifiable characteristics to different musical forms and running those values through a Principal Component Analysis algorithm, I discovered that alternative rock like Wilco really is a mix of sound components from rock, country, and blues! MusicBox also shows me visually that They Might Be Giants spans many genres, including rock, dance, slower country-rock, and even verges into rap territory at times, while an artist like Kiss is much more focused in the center of the rock genre.
My favorite find was that one particular Daft Punk track kept appearing next to classical and ambient pieces while all the other Daft Punk tracks were sitting in dance territory. But when I played that track, it made so much sense! It was Daft Punk’s “Nightvision” (from their Discovery album), the slowest tempo Daft Punk song I have, which sounds a lot like digital waves landing on a shore with strings playing in the background.
Related Content
-

Startups, Data and Fundraising - an Interview with Amanda Kattan
Amanda Kattan data and finance consultant -

Data for Good with Aziz Alghunaim, Co-founder and CTO of Tarjimly
Aziz Alghunaim Co-founder and CTO Tarjimly -

An Interview with Daniel Mill of The New York Times
Daniel Mill Director of Marketing Analytics The New York Times