April 2018 Product Update
Posted by on May 3, 2018 Chartio
We want to start off by saying thank you to all our customers who have helped to shape Chartio as a product! We are always excited to share with you all the updates and progress we’re making. This month will be the start of a new tradition where we share with you a more intimate look into our product momentum.
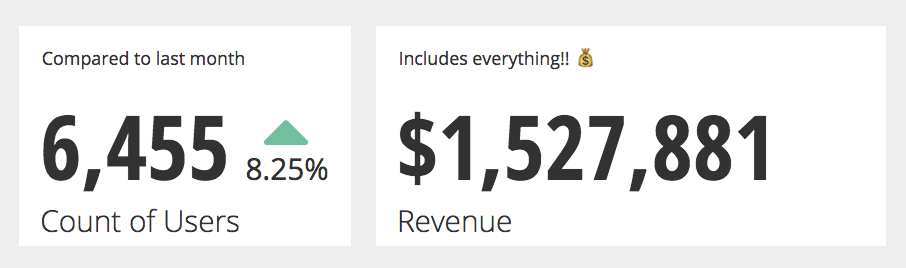
You Spoke and We Listened; Feature of the Month: Conditional Formatting for Single Value Charts
Single Value Charts are one our most popular chart types used by our users. Looking at all the charts created this year by our users, 16.5% of those charts are single value! They’re great for visualizing and ensure the value stands out at a glance.
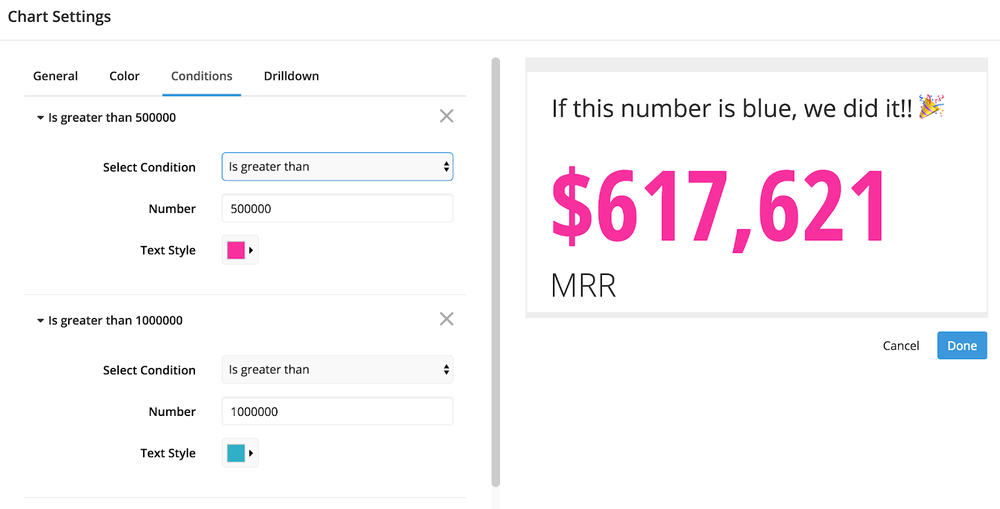
The most popular request we’ve gotten surrounding the single value charts was the ability to set the color of the value based on a condition (see example below).
Join the Conversation and Tag Other Users Too!
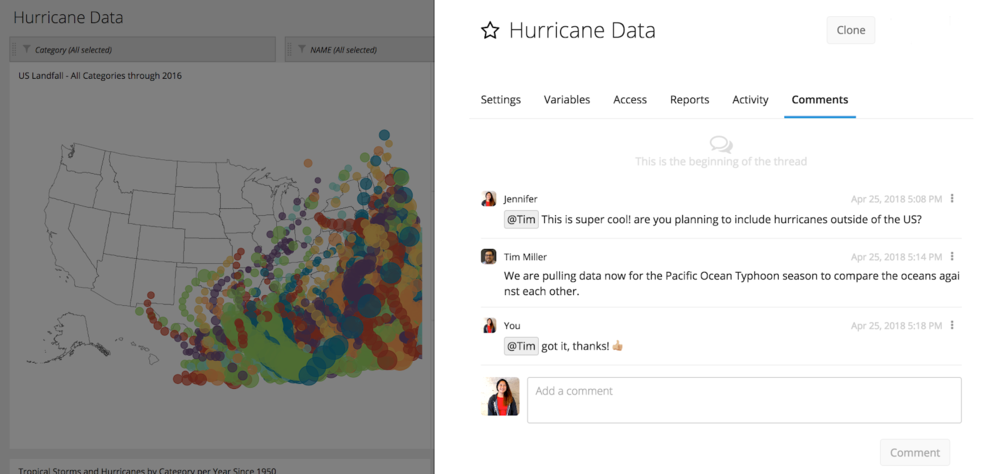
Last month, we released Dashboard Comments! In Chartio, it’s easy to build dashboards and share them with other users but ensuring questions, feedback, and comments are addressed properly can be tricky. Though we saw some creative utilization of our text elements being used to relay feedback and comments to dashboard admins, we knew we could provide a better outlet for those exchanges. We started with releasing Dashboard Comments as a simple tab to log comments and quickly saw the adoption of our comments feature amongst our users. It became apparent that while leaving comments, feedback, and questions is important, ensuring those get directed to the right people was even more important. Since a dashboard can be shared or managed by many different people or teams, it’s vital that high priority questions or comments notify the right users. That’s why we were excited to announce that user tagging is now available in dashboard comments! So keep up the conversations and tag away!
A Sneak Peek for May
Our focus for this quarter is to help improve data governance and product usability. So what’s next for us? We do have a wonderful release in store for May Day! Check out the data source page today and see a brand new data source. Hint: It’s green, starts with a G, and ends with sheets!
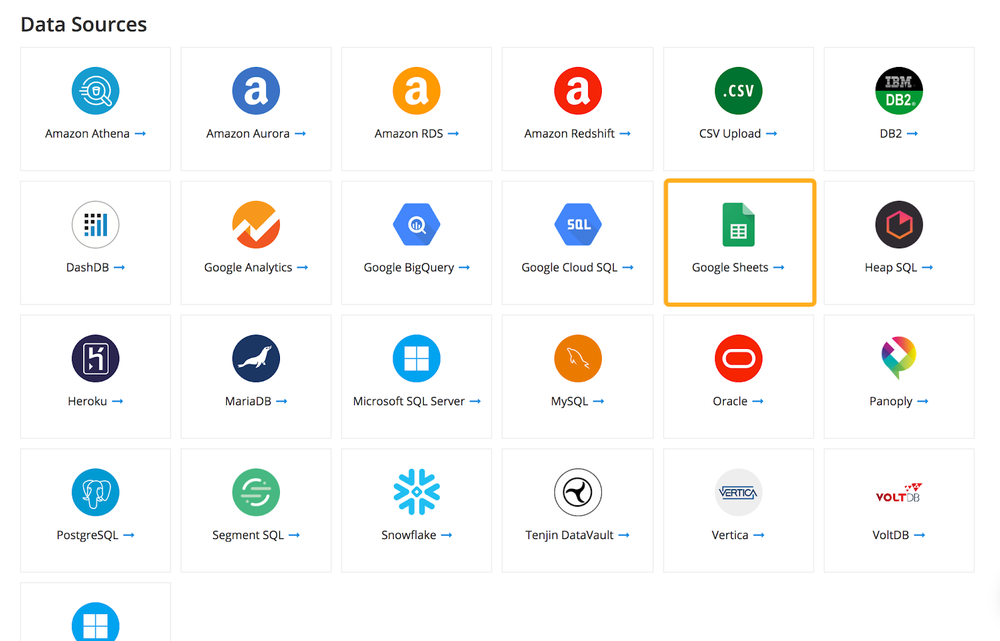
In addition to Google Sheets, we’re looking to release some features in the next month targeting data source usability, caching improvements and user management. We’re always open to hearing your input so if you have feedback or feature requests, let us know at support@chartio.com!


