Building a Data Stack: Stitch and Chartio
Posted by on August 17, 2016 Chartio
Data is your company’s most valuable asset. In using data, Executives are able to accurately forecast revenue and marketers are able to run efficient campaigns. Without data, we’d all be going at it blind.
To unlock the full reach of your data, you need to make sure it’s extracted, processed, consolidated and transformed into insights. The key here is consolidating data from various sources. So, instead of drudging through different data sources and working in a vacuum, it’s time to bring data together.
Because Chartio connects and easily blends your many data sources, you’re able to see everything from product usage to marketing conversions—all in one place. We partner with great companies to transform your data into visual insights. Today, we’re excited to announce our partnership with Stitch, a powerful ETL service built for developers that consolidates data and readies it for analytics.
The ETL process is an important segment in extracting insights from your data because it decreases the time it takes to get from point A (raw data) to point B (insights).
Eliminating Data Challenges
Our partnership with Stitch is important because it brings together multiple data sources into your data warehouse, which you can then push into Chartio and perform analyses. Historically, companies struggled with getting a complete picture of their data for two main reasons:
-
Limited Analytics Tools: Data analysts require a more robust tool than what was offered via built-in analytics tools. These tools were often clunky and didn’t allow them to perform more complex analyses.
-
Siloed Data: Data analysts were plagued with the inability to join data from disparate sources and departments. This caused headaches in not having the full picture on the business—whether it was customer lifecycle, sales pipeline management or product usage.
Fortunately, Stitch eliminates this problem as it integrates with a variety of analytics, business, CRM and email data sources such as Google Analytics, Salesforce, HubSpot and MongoDB. For a complete list of Stitch’s integrations, view their Integrations page.
Once you have integrated and consolidated your data sources via Stitch, you can then push all of your data into Chartio and get a complete view of what’s going on in your business. Our partnership with Stitch allows you to easily build and have a reliable and cost effective data stack.
The Full Power of All Your Data
With a fully managed ETL service, you’ll be able to move your data from one place to another at scale. When data is blended together in Chartio, that’s when your company will get the most value out of it. Through this process, you’ll be able to uncover trends and answer business questions.
You’ll be able to answer crucial business questions such as:
-
What is the average time a user spends reading through our product documentation and how does that relate to the overall word count?
-
How many active users were on our website on Tuesday at 9am PST compared to two weeks ago?
-
What events played a specific role in moving a lead down the funnel and eventually through to conversion?
-
What is a common user interaction with your e-commerce platform on your website?
Blended Data in Action
Thousands of marketers use HubSpot as their marketing automation tool. Many of those marketers face the challenge of not being able to view their HubSpot data alongside any other appropriate data source.
Instead of siloing data, consider building a full analytics stack with an ETL to surface your data. To fully understand the powerful relationship between an ETL and Chartio, below are some examples of how our customers use Stitch to connect their HubSpot and Salesforce data with Chartio.
Sales Funnel
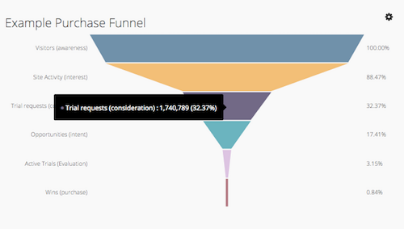
Blended Hubspot and Salesforce data.
Prior to Stitch, customers had to dig through HubSpot and Salesforce data and extract information separately from each database. This process was tiresome and often required Engineering resources. In using an ETL service, like Stitch, customers are able to view email marketing data alongside their Salesforce data and perform analyses in Chartio.
Trial Activation by Email
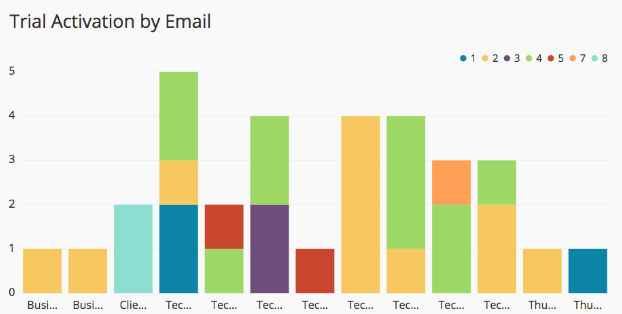
An example of a Chartio dashboard based on marketing efforts consisting of trial activations within an email campaign.
The above example is a representation of an email campaign consisting of eight separate emails sent to prospects during a specific time frame. Each email is then color coded, email one is dark blue, etc. This dashboard visualizes at which email a specific persona activated a free trial. The number on the left suggests the number of trial activations by email.
Through these analyses, our customers are able to discover opportunities for improvement and find the messaging and content that performs well. Without an ETL service and BI tool integration, however, none of these insights would have surfaced.
Conclusion
Alongside HubSpot and Salesforce, Stitch connects with a number of SaaS tools,. In consolidating your data and integrating the data with Chartio, you’re able to get the most value out of your data.


