Chartio Tops Global BARC Survey in Implementation Time, Employee Use, and More
Posted by on November 2, 2015
We’re excited to announce that in our first year of participation in the annual BARC survey of BI users, Chartio was the top-ranked tool in four KPI’s and a peer-group leader in fourteen others in BARC’s fourteenth annual survey.
We’ve been saying all along that Chartio leads the market in its unique combination of usability, agility, and penetration of the organization. But it’s gratifying to have an objective third party validate our claims.
Chartio’s vision is to make business intelligence as widespread in the organization as the common spreadsheet, and this report shows that we’re delivering on our vision.
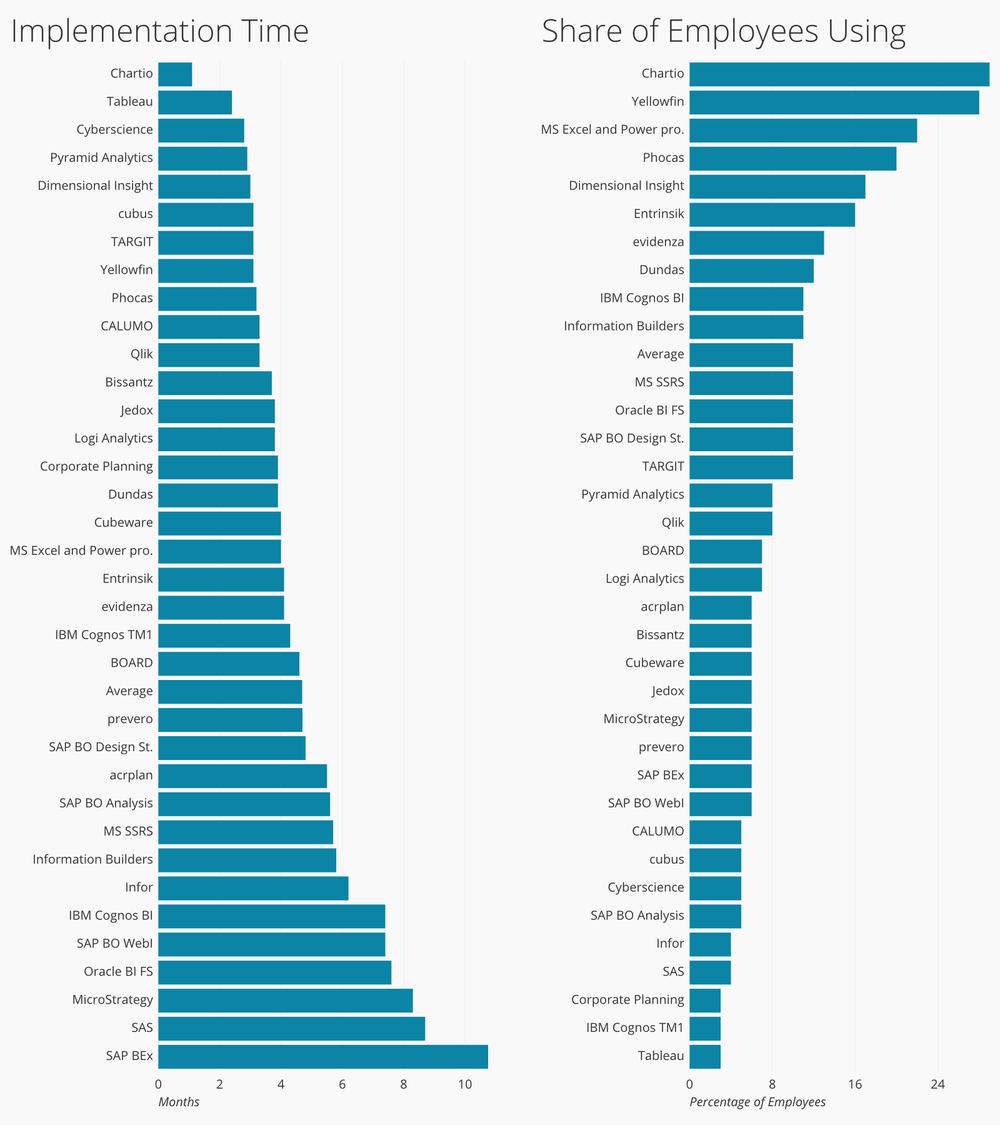
You can view highlights from the BARC BI Survey, but here are a couple of measures that got us excited. Chartio users reported the fastest implementation times, at half the time of the runner-up. And we showed the largest percentage of employees using our BI tool, with an average of nearly a third of the employees in our customers using Chartio.
This is a vivid demonstration of our agility and ability to serve more than a handful of analysts.

Chartio was the best of 35 BI tools from 30 vendors in Implementation Time and Share of Employees Using a BI tool.
Chartio also received top scores in Data Discovery/Visualization (91%) and Cloud BI (62%), and was ranked as a Leader in another fourteen KPI’s among Mid-Size Deployments in the Americas:
-
Ease of Use
-
Agility
-
Self-service
-
Innovation
-
Project Length
-
Willingness to Recommend
-
Collaboration
-
Local Intelligence
-
Competitive Win Rate
-
Project Success
-
Chosen as a Standard
-
Vendor Support
-
Operational BI
-
Price-to-value perception
This is Chartio’s first year of participation in the BARC BI Survey. In 2015, BARC surveyed 3,267 business intelligence users, consultants, and vendors. A total of 35 business intelligence tools from 30 vendors were evaluated in the survey. It’s the largest survey of BI users, and is now in its fourteenth year.


