Chartio’s CSV import tool was already easy to use, but we’ve made some improvements to help you finish your imports faster and get started with your analysis sooner.
I used the new import feature to analyze some CSV data I happened to have handy, and I’ll show you what I did at the end of the post.
Manage your import in a single step
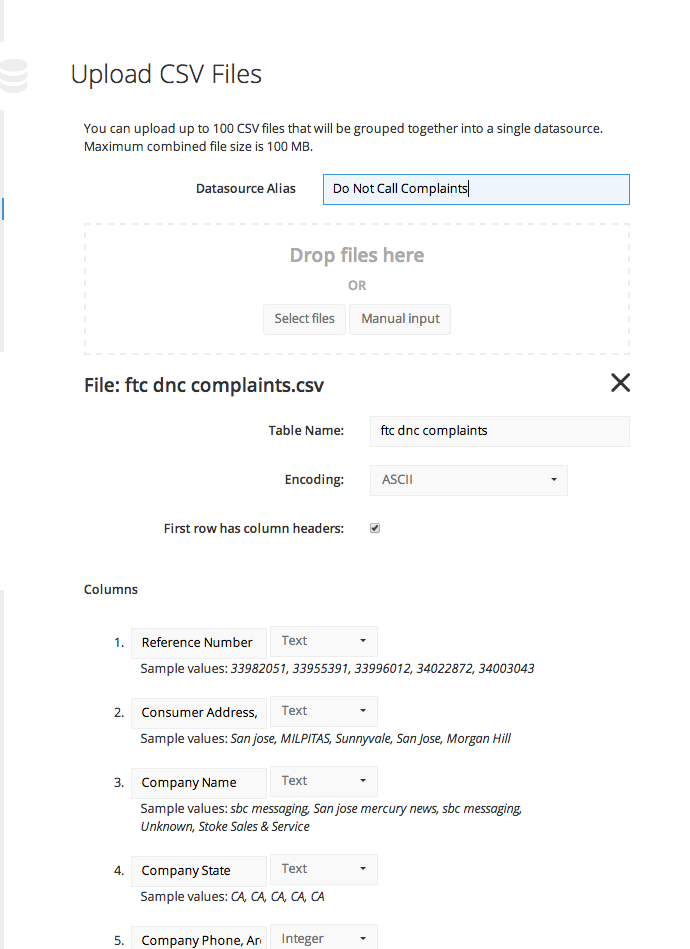
We’ve left behind our original multi-step CSV import process. Now, you can set up your import on a single page: alias your data set, name your tables, review your column names and data types, and upload your file.
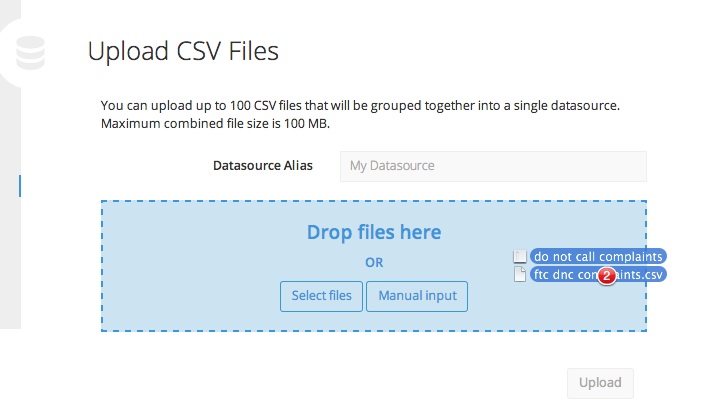
Drag and drop your CSV files into Chartio
Chartio has long offered the option to upload files from your computer using your browser, by selecting them in a dialog box. But we’ve added the option to drag your files and drop them onto the Chartio CSV upload page. We’ve also added a Manual Import option that allows you to paste CSV data from your clipboard into a browser window.
Often, a data set will be spread over multiple related text files. Chartio lets you upload all of your files at once. These files will be treated as separate tables in a new datasource, but you can connect them by setting up joins in the schema editor.
Naming your datasource, tables, and columns
Once you’ve dragged your files onto the import page, you’ll be able to give each element a name. You can also upload more files into your new data source.
Start by giving your new datasource an alias. The alias is the name that will be used for this collection of files on Chartio.
Then, name each table. Chartio will default to the name of the original text file, but you’re free to choose a different name.
Next, name your columns and confirm their data types. Chartio will show you sample data and suggest column names, based on the first line of your source file. You can edit these names before you complete your upload. Chartio will also suggest a data type for each column (such as integer, decimal, text, or date), but you will be able to choose a compatible type for each column. If a column contains dates, you’ll need to tell Chartio the format of the date information.
Once you’ve done this, Chartio will complete your upload and your new dataset will be ready for analysis.
Fun with data
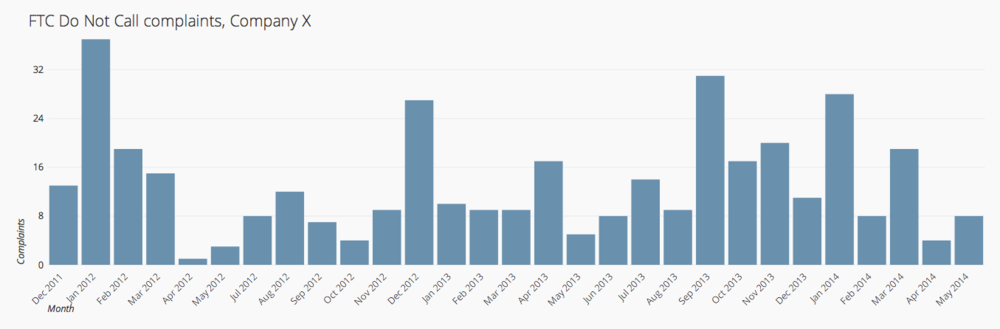
I happened to have a file of complaints about a particular Bay Area company from the FTC’s Do Not Call page, which I obtained earlier this year using a Freedom of Information Act request.
I charted these complaints by date, but I couldn’t see any obvious trends.
After I charted the number of complaints by city, I saw that San Jose, the largest city in the dataset, was (unsurprisingly) the source of most of the complaints. But which were the most put-upon communities? I uploaded a file of Bay Area city populations (h/t Wikipedia) and calculated the number of complaints per 1,000 residents using Chartio’s Data Pipeline.
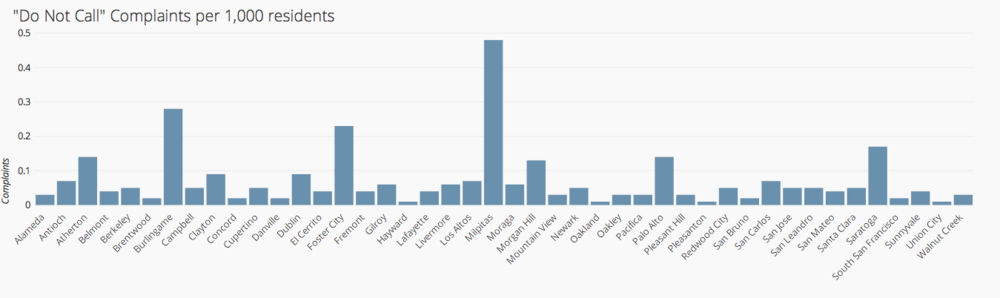
Looks like a disproportionate number of complaints coming out of the relatively small town of Milpitas. This bears looking into.


