COVID-19 and Our Remote Work Response
Posted by on March 18, 2020 Chartio
Like many of you, we’ve been keeping a close eye on the progress and realities of the COVID-19 virus. At Chartio, we’ve been doing everything possible to ensure the safety of our employees, and the smooth continuity of your Chartio service.
Beginning a week ago, we moved all of our employees to remote work. Already having multiple offices and being a completely cloud-based company have made this transition relatively smooth.
For our customers, the Chartio experience has not changed. Our customer success, engineering, and operations teams are prepared and already working in a fully remote environment. All the systems and service providers we depend on are cloud-based and prepared for this new normal, just as we are.
Now, settled into our new realities of remote work, we’re motivated to help wherever we can. We’ve evaluated our product roadmap and prioritized key features for better enabling ourselves and our customers to work remotely. We have a few key features already in design and early development, and would love to hear your thoughts and ideas on these and others:
Chart comments
We’ve been wanting to build this for a while now - and with the reality of how essential commenting features have become in tools like Slack, Google Docs, and Figma, we realize we really need this in the Chartio experience.
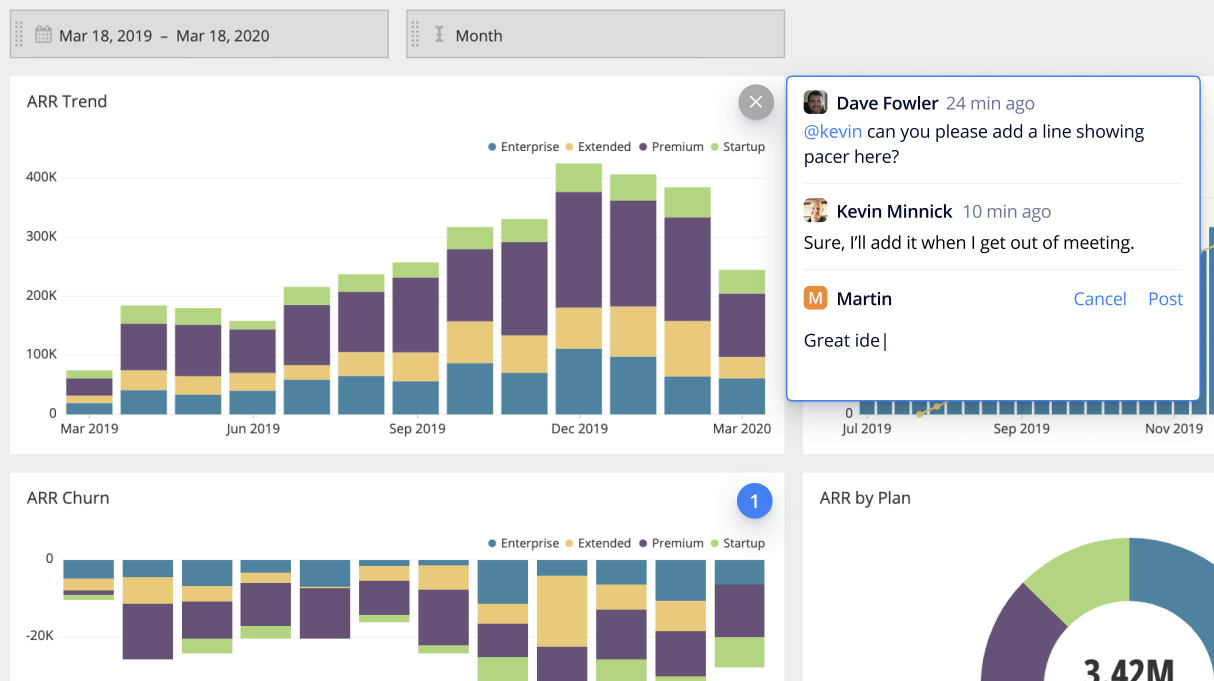
These comments will work a lot like Google Docs and we think will greatly improve collaboration and workflows—and even reduce data doubt—in teams. We expect comments like “@tom will you help me with this query?”, “Why are MQLs down right now?”, “@alice this doesn’t look right - my other dashboard says there were 8 new sales yesterday. What’s different?”, etc. All important conversations that are harder to have while remote, and much more impactful when they can be applied directly to the context of a chart.
Telling data-driven stories
With all that’s happening in the news these days, we’re looking for any datasets that aren’t being well covered, but should be. If anyone has any relevant datasets - perhaps not on COVID itself (you can find much of that already covered here), but more on how businesses are being impacted and bringing awareness there, such as this great graphic from OpenTable - we’d love to be helpful in getting that data visualized and communicated in an effective way. If we can help, reach out to support@chartio.com.
What else? We want ideas!
We continue to also work on our regular product roadmap, but are keen to hear more ideas around how we might help you in your new remote work situations. How can we make Chartio more impactful and useful for your team over these next weeks/months of remote work? Leave your thoughts in our community Slack, or email us at product@chartio.com.
Delivering
It’s too early to give a timeline for when to expect these updates, but we aim to get them out quickly. Regardless of where you work, these features will support you in your efforts to work smarter and more collaboratively with your data.


