Today’s feature update is for your data source settings. A major focus for Chartio is helping to manage the connections, and access to your collection of data sources. With that in mind, we’ve added better navigation for the settings options - so now when choosing a data source you can tab between the basic settings, connection settings, debug, schema, and query log pages.
Read about these new tabs below:
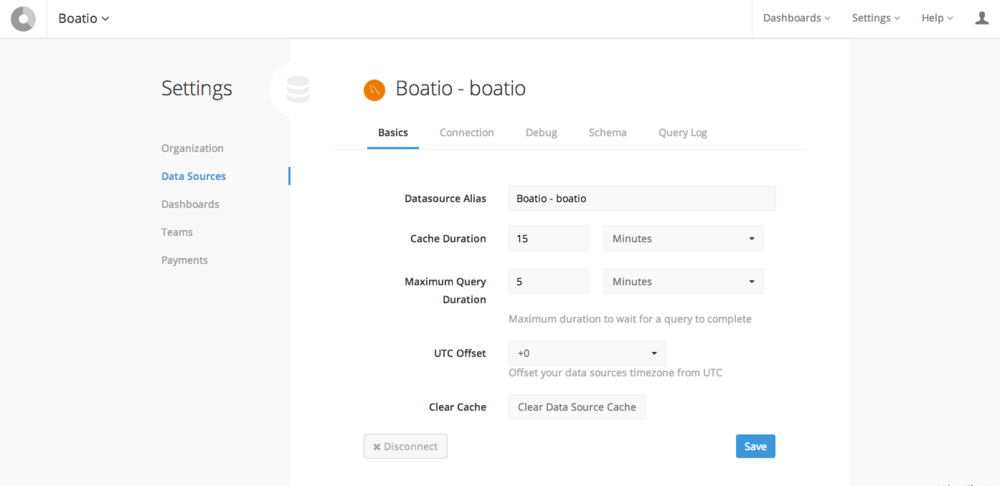
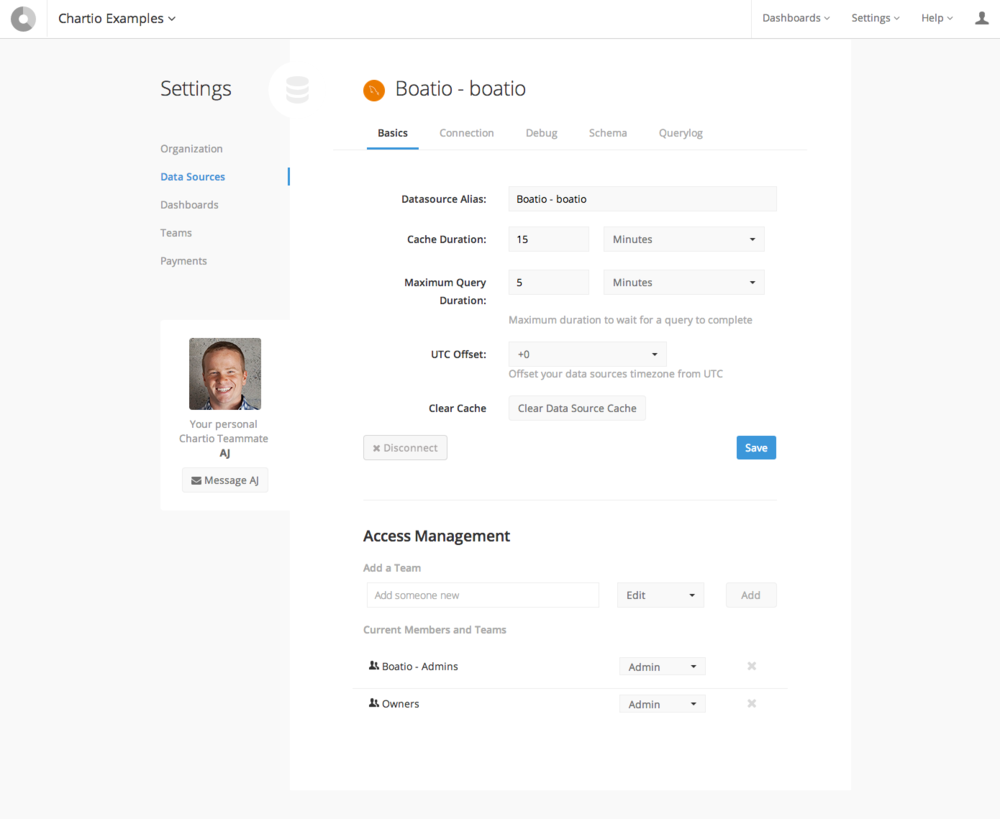
Basics
We separated out the previous settings page into Basics and Connection and moved the Clear Cache and Disconnect buttons into the Basics page. Inside of Basics you can edit the data source’s alias, cache and query duration, the UTC offset, and the data source’s access management.
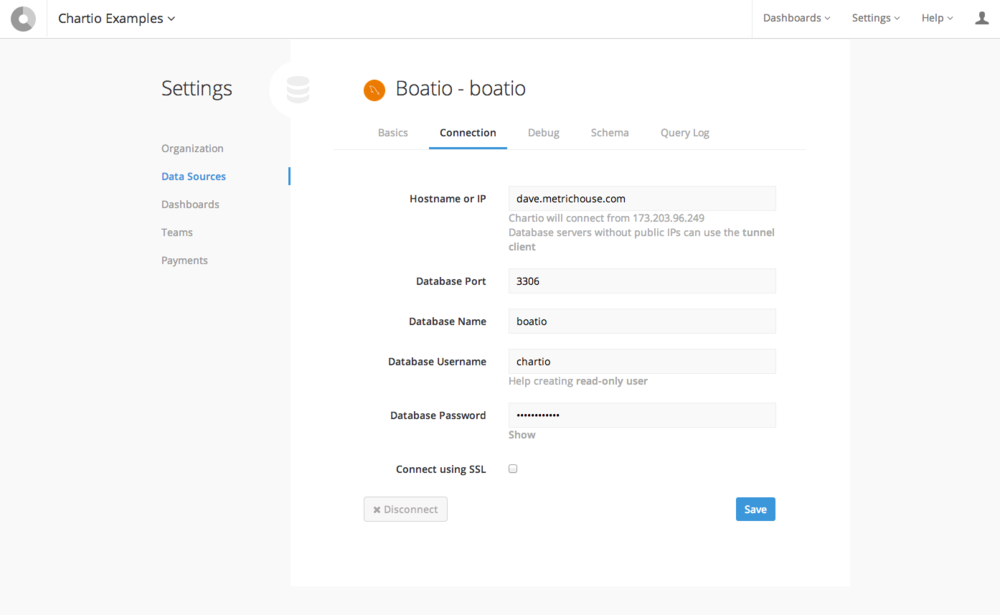
Connection
The connection page allows you to edit parameters used to connect to a given data source. For a database, this page will allow you to configure things like hostname, database port, name, username, password and choose to connect using SSL.
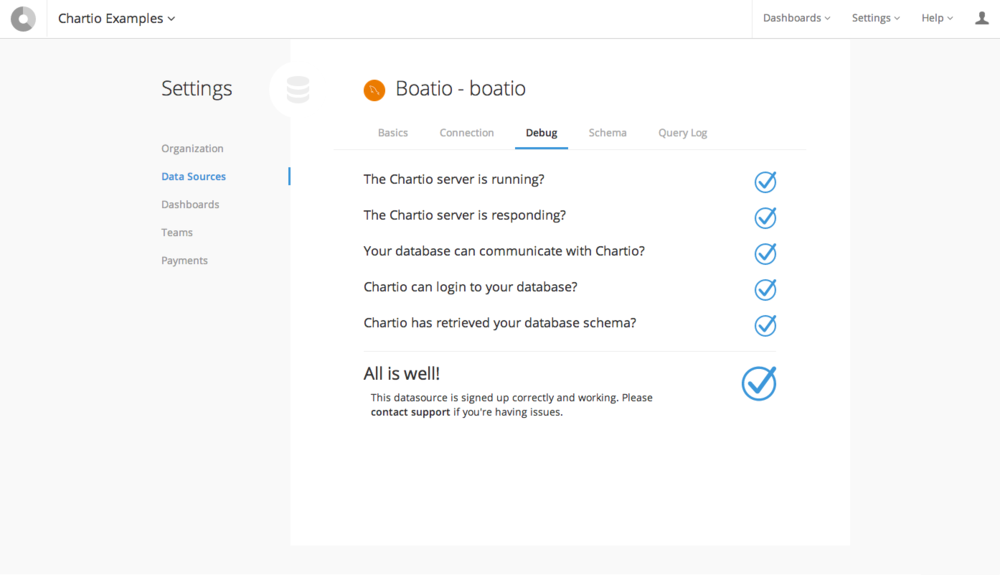
Debug
The debug page is your interface to checking the data source connection - Chartio will run a series of tests on the different aspects of the connection that could go wrong.
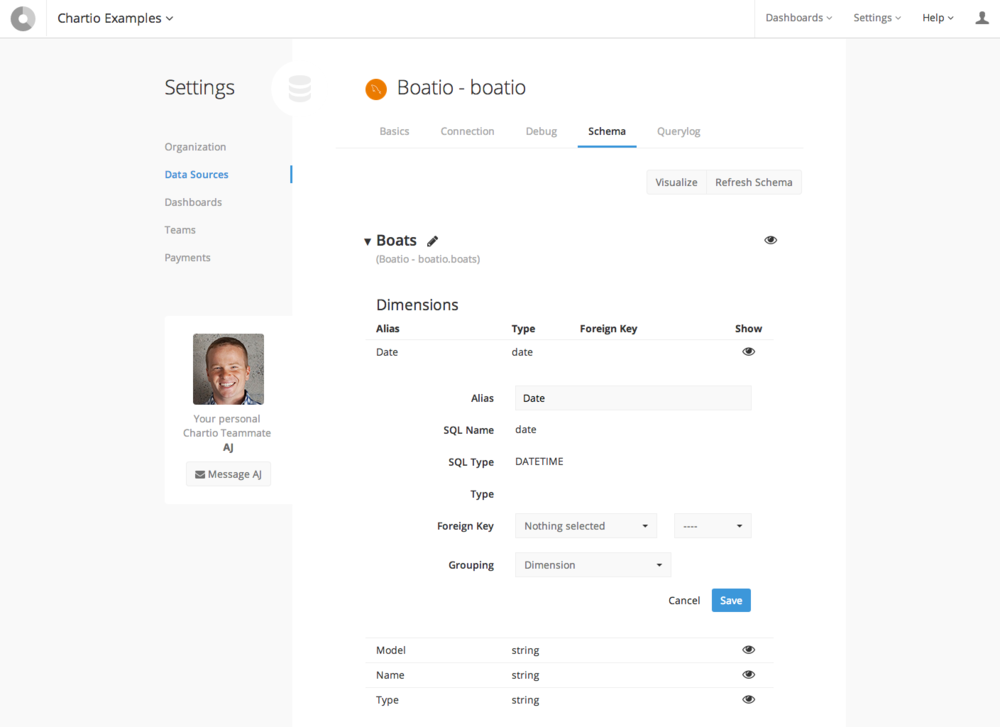
Schema
The Schema page has undergone a redesign - to edit individual columns, click to select the column and a form will appear to allow detailed edits.
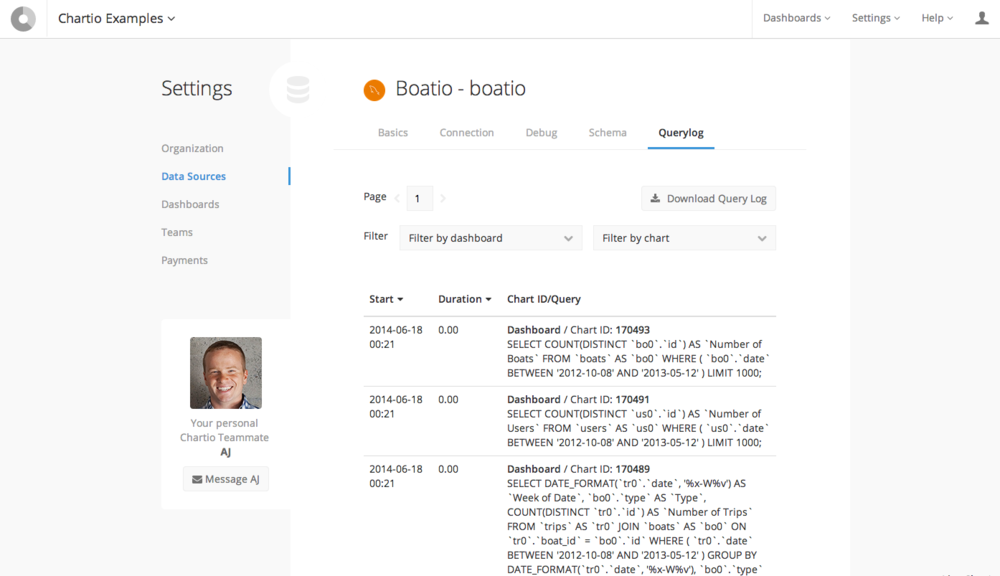
Query Log
The Query Log has also undergone a redesign. You can still sort the log by time (Start or Duration) but now you can also filter the log by dashboard and chart. We envision these updates will save you time when you are looking for dashboard or chart specific queries.
We hope you love these new updates, keep posted on the blog for more to come! As always let us know what features you want to see at support@chartio.com.


