Off the Charts: An Interview with IMVU: The Startup Dashboard
Posted by dave on February 21, 2011 Off The Charts
Paco Nathan is a brilliant guy. He walked us through some of the critical points about data both in a large organization and a small, scrappy startup. Data is crucial, and a great dashboard can really bring important metrics to life. And the goal, as always, is to make sure you’re making really good business decisions.
To get started, can you speak broadly on the purpose of data visualization in a business context?
My view of data science is one which is very much accountable to business. And if you’re in a business, you’re swimming in a sea of data. Even when you know your business well, data visualization will still help uncover important nuances. Maybe not all, but you’ll discover lots of useful insights and be guided toward the relevant next steps for analysis.
One common mistake that is that people tend to just use MS Office to “navigate” through an unfamiliar data set. Import some CSV data into Excel, maybe make a pie chart, cut&paste to PowerPoint, done.
However, when you’re first encountering a data set, Excel is horrible for developing data insights. Avoid it. It’s simply not good at all for discovery. I see data visualization, instead, as being key for the first steps. So if you’re running a business and you’re not asking “Where are the data visualizations?” then you’re doing something wrong.
When I talk with a candidate analyst, I really want someone who will go into the data and discover interesting insights. Discovery is the front lines for where you begin to determine whether there were problems with data collection, or other systemic data quality issues, or perhaps if there are outliers you should be noticing. If you don’t look at the data, e.g. as a scatter plot, you won’t know what to attempt to model in your subsequent steps.
Can you elaborate on that point? [ The importance of Data Discover-ability vs. just Data Visualization ]
Let’s say someone is running experiments about sales versus product price points. Consider a multi-modal distribution … if you’d used Excel to compute an average price for the sample, you might miss the nuance that the sample has a high-price/low-volume segment combined with a low-price/high-volume segment. Instead you end up with an averaged price point where no one wants to purchase.
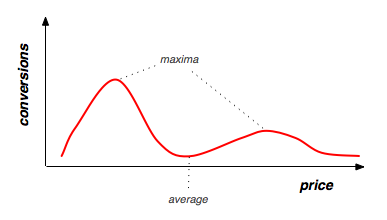
Pricing FAIL, so to speak. So to ask the question on data and business slightly differently: Inside a business, which functional groups need data the most to effectively do their job?
An interesting point about data in a business setting is its role as an equalizer. Let’s say you have two different business lines and you’re determining which to support with additional resources. Unless there’s a strong data-driven culture in place, you will tend to find some product owners who are great at arguing on behalf of their business unit, great at winning arguments with rhetoric. Whoever makes the most compelling case wins resources. However, the moment an analyst drops a good data visualization on the table, that rhetoric collapses. People who may have been wallflowers before now get a voice at the table. In other words, visualization allows the process of “data storytelling” to become less arguable, less subjective.
For a different perspective on the same issue: when I create a data visualization for a product owner, who sees it for the first time and simply points at some crucial interaction which defines their business - no detailed explanation needed - then I get confirmation that we’re heading in the right directions. Visualization leads to an important kind of closure in the relationship.
Over the past 10 years there’s been a lot of talk about creating data-driven cultures, do you think that’s been more hot air than reality?
One problem is there’s been much focus on capturing data, but not as much about effectively using data. Lots of vendors will tell companies, “Hey, sure we’ll capture tons of data for you,” and then those projects get funded, but they never quite reach the point of figuring out how to analyze or model the data at scale, let alone improve revenue by leveraging analysis. That leads to inevitable backlash within organizations, which will reflect in the next year’s budgets.
So the question about Big Data becomes, “How can you store terabytes per month and make it worth your infrastructure costs?” Some, such as ad companies and online dating sites, have been through the fire on this point, and have made Big Data work. For the rest, that remains to be seen.
How should recent engineering or stats grads think about the next ten years in data?
Well, we’re not going to see a one-size-fits-all database stack. I think looking back at the past 10-15 years range, there has been an effort by Oracle to do exactly that. But the one-size-fits-all approach doesn’t really work. For recent grads with intellectual tools, I’d advise to get hands-on experience with real data and understand the different shapes and sizes it takes. That’s important because there’s going to be a lot of diversity among vendors and solutions. You need to become familiar with which approaches to use, in which contexts.
There are many different ways you can leverage data - for example maybe you are looking at real-time trending, or perhaps on a different time scale you’re looking at cohort studies. Time as a variable tends to be how the “shape” of the data and resulting access patterns get differentiated. Different access patterns tend to require different data management solutions. As an exercise, review your current analytics projects and for each one, describe the relative rates at which data gets collected versus the rates at which its analysis is needed. That should show a lot about your data access patterns and which kinds of data management are indicated.
Now, just to get really concrete, if you were starting a company and had to create just three charts, what would they be?
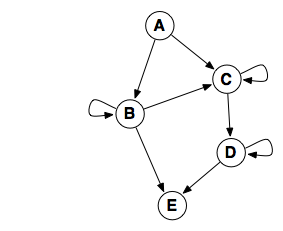
One of the things I do at every company when I walk in the door is to draw a graph, a DAG. Then I start labeling events on this graph. People in online advertising tend to know this exercise like the back of their hands: impression events lead to click events which lead to action events, etc. If you construct a graph of events as “sources and sinks”, then you can begin to assign probabilities to each arc, and perhaps even infer probabilities in some cases which are difficult to measure directly. Often there can be a relation stated between probability and inter-arrival time - the time it takes to move between events - which can allow you to infer even more potential unknowns. This is great for modeling how a customer moves through the proverbial “funnel”. That in hand, you begin to have a model for must of the business. We can do lots of useful simulations at that point, but having a visual representation of the graph is wonderful to capture the business process as a whole. It will change over time, and comparing those changes will become crucial for your decision making.
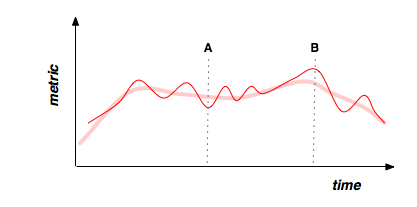
Then, you should have control charts which show different operational metrics. Design them so you can compare events happening over time, like stock tickers going up and down. Determine variance for each metric, show confidence intervals, show smoothing such as time weighted moving averages. I also like to annotate the control charts with logs of major events - that’s great to correlate visually, so people can work together to troubleshoot peaks and valleys which might otherwise be difficult for any one person to explain. I think of this as a “live journal” so to speak of the company’s operations.
Find some metric which is interesting and important for your business, which changes over time. Turn it into an animation. For example, plot hourly revenue, save the plot as a PNG, repeat creating snapshots from every 15 minutes for the past 48 hours, then stitch those into an animated GIF. These animations are great for helping people across the organization understand the metrics rapidly, because animations compress time, making the information easier to digest.
Related Content
-

Startups, Data and Fundraising - an Interview with Amanda Kattan
Amanda Kattan data and finance consultant -

Data for Good with Aziz Alghunaim, Co-founder and CTO of Tarjimly
Aziz Alghunaim Co-founder and CTO Tarjimly -

An Interview with Daniel Mill of The New York Times
Daniel Mill Director of Marketing Analytics The New York Times