"Making Data Beautiful and Easy." A Beginner's Review of Chartio
Posted by on February 8, 2021 Chartio
Any fans of Chartio know that their mission is to democratize data, making it accessible for professionals of all levels within an organization. For a business to be data-driven, and to plug in data in every department, you need either to have every single employee be a data scientist (impossible) or to have a platform that’s user friendly for even those with the most basic data skills.
That’s me.
As a member of the marketing team for Product School, data informs a lot of our decisions. We need to know what content people need the most, what they respond well to, and how we can better serve the needs of our community. As any good Product Manager will tell you, users don’t always know what they need, you have to go into the data and find out for yourself.
But I’m no data scientist, I’m a digital creator. I can’t spend a huge chunk of time on ‘SQL’ (whatever that means) and going through tough excel sheets I only half understand. So I started my journey with Chartio, in the hopes that their user friendly interface and plug-in-and-play charts would make my life a little easier.
If you’re trying to choose your new data visualization tool, or you’re trying to find something beginner-friendly for all of your teams to use, here is my beginner’s review.
Onboarding
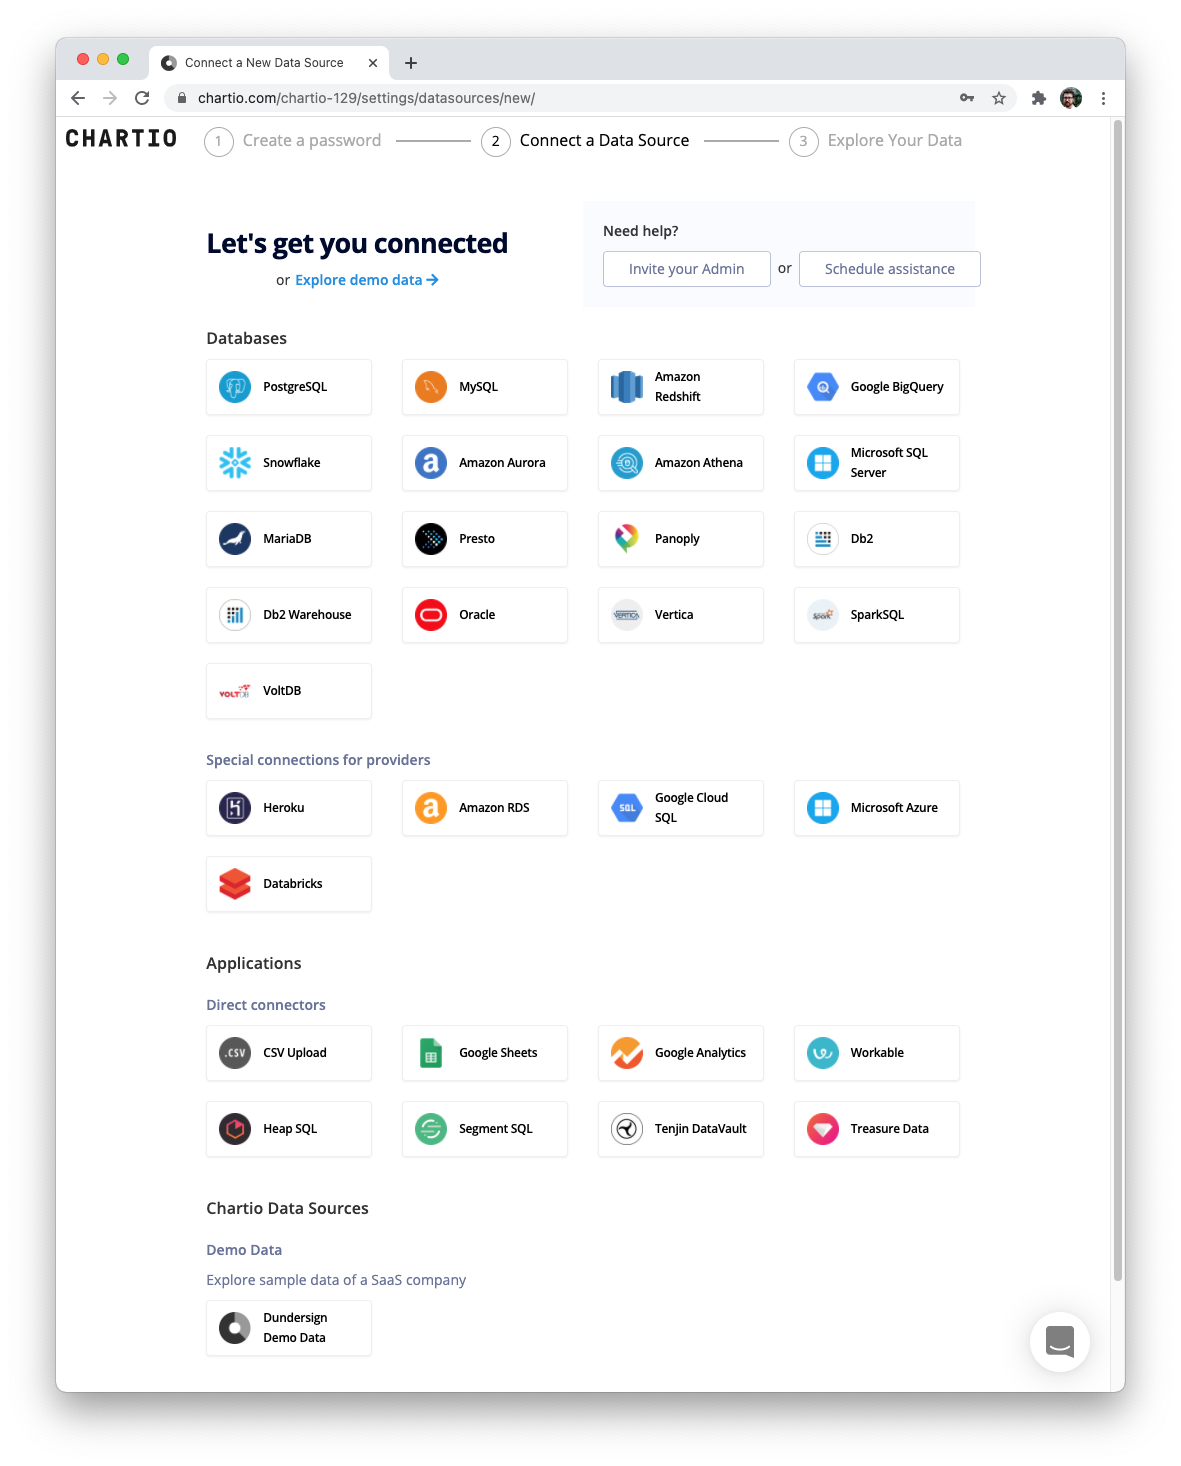
The signup process was incredibly simple. For those of you who are concerned about privacy, you’re given a test set of data to play around with before you decide to commit and plug in your own data. Chartio supports an incredible number of data sources, so you’re ready to go whether you’re using a fancy database like Oracle, or you just have a simple .csv file. No need to mess around converting or exporting files.
I’m a simple woman, and I appreciate a useful onboarding email, which I believe are very underrated.

Chartio’s onboarding email gave me a variety of options depending on my goals for the platform, and also my level of skill. I could either jump in and build my first chart, schedule a data connection session, or join Chartio for virtual office hours.
Being the brave marketing daredevil that I am, I jumped straight into building my first chart. The first thing Chartio does is present me with a video on learning visual SQL. It’s a great quick-bite video that makes SQL easy to understand for beginners, and having these learning materials available in-platform is much simpler than having to Google things for myself.
Chartio has options to work in visual and regular SQL, meaning that more advanced users will feel equally comfortable with the platform.
Usability
So now it’s time to run my first query. At the moment, when I have a question about data, I usually have to ask someone else if it’s not something I can learn from glancing at Google Analytics. So my hope is that Chartio is simple enough to use, that I can get my own insights and go down any rabbit holes by myself.
After watching the helpful how-to video, it only took a few clicks to create my first chart. The UI is very intuitive, so after being shown around by the onboarding process I already feel fairly confident in building my first chart.
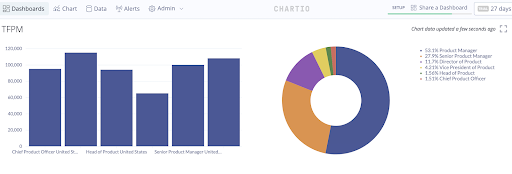
When you’re not used to spending all day working with data, being able to visualize it while you are querying it goes a long way in helping to make sense of it. Unlike other data tools I’ve used in the past, which gave me unhelpful spreadsheets that might as well have been ancient hieroglyphics, Chartio makes the instant connection between the data you input and visualization. This makes answering the questions beginner-users have about their data much easier to answer.
More Cool Things
Now I’ve gotten to grips with the basics of Chartio, I wanted to highlight some of the features of the product that really stood out to me.
1. Embedding
One of the few parts of data I’m familiar with, is the need to share data visualizations with people outside a company. As a content creator, being able to share data dashboards and have them embedded within a website or product is incredibly exciting. With Chartio’s new interactive embedding, we’re able to embed fully interactive dashboards onto our website in order to share information with our community.
I’m sure that the sales and leadership team will also be making the most of this feature as they share information with our partners.
2. Visualization library
Other beginner-friendly data visualization tools make the mistake of limiting how customizable the final charts are. Just because we’re mathematically challenged doesn’t mean we want to be any less accurate with how we present our information. That’s why Chartio’s new and upgraded visualization library is so impressive.
With these charts, accuracy doesn’t have to be sacrificed for beauty, as everything is endlessly customizable. You can either go into deep levels of customization to get your charts exactly how you want them, or stick with the default settings, depending on your skill level. I can easily imagine collaborating with more data-inclined team members to make dashboards and charts that work for everyone.
3.Customer service
The unsung heroes of the product world are the customer services teams! With Chartio, you’re only ever a few clicks away from being able to speak to a real human being. Not just for customer support, but for education and general queries about the platform. They really are data gurus.
Chartio’s Mission
One of the most unique features of Chartio isn’t even a feature…it’s their mission. This is a company that doesn’t just talk the talk, they walk the walk. It’s easy to say you want to democratize data and make it accessible for everyone, but it’s another thing to build a platform that actually does that. Chartio is a platform that has certainly made data accessible and easy for this beginner.

This guest post is written by Ellen Merryweather. Ellen is a Content Manager at Product School, a global leader in Product Management training with a community of over one million product professionals.


