In mid-April, Mozilla announced project Stone Ridge, a performance testing framework for necko (the networking layer in gecko, Mozilla’s open source browser engine). We were contacted by Mozilla for help in visualizing Stone Ridge, i.e. the performance of various networks, in a public dashboard format.
Stone Ridge was built to help Mozilla test the effects of networking code improvements across different types of network providers, from commercial broadband to mobile phones in the developing world. By testing often and visualizing trends, these simulated network stats help them test speed improvements and check against performance regression across connections.
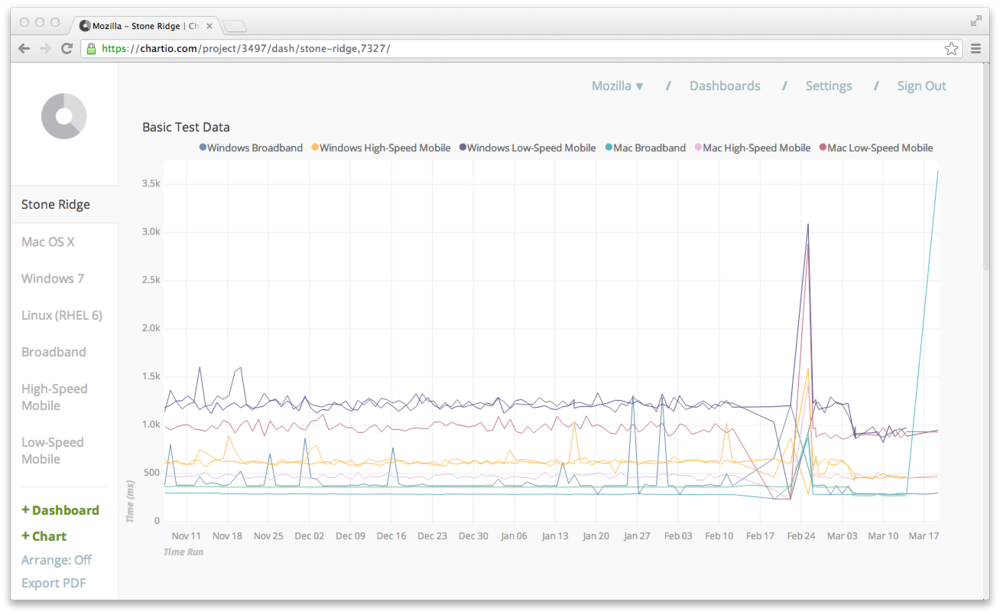
In true open source spirit, Mozilla wanted to make their dashboard public to be able to share the network performance data live with the Mozilla community. This is the first time we’ve have had the request to make a dashboard public, and we worked closely with the Mozilla team to make that possible. We’re looking forward to working with more open source projects to help visualize community data.
This is a great example of a customer visualizing other types of data in Chartio. Many of our customers take business data, make important business decisions off the data, and then share with various teams. We made Chartio flexible enough to interact with various data sources so users can explore any type of data. We love the fact that Mozilla is using Chartio to visualize network performance data and sharing it with the community, so they can see how the network is performing and increase the speed in how Mozilla reacts.
If you are interested in having a public dashboard like Mozilla email us at hello(at)chartio(dot)com. Or if you want to get charting today, [sign up] (/trial/) for your two week free trial and start using Chartio!


