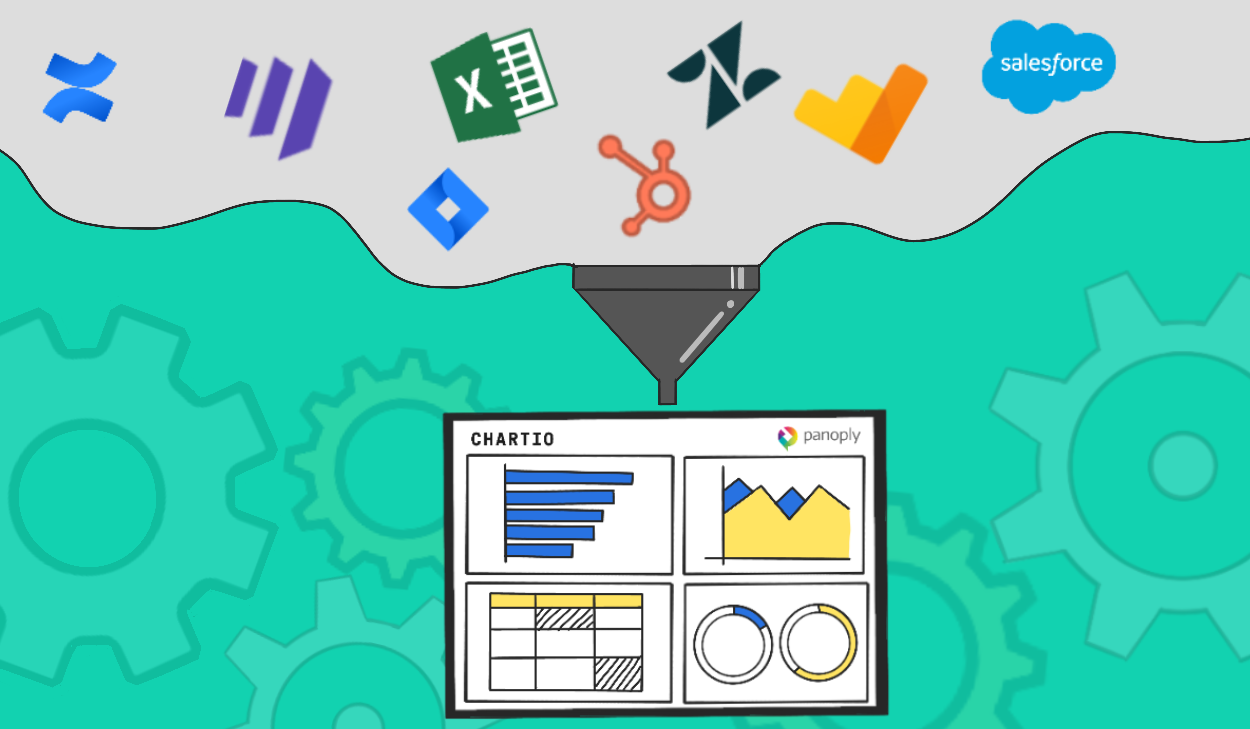
We’ve recently complimented our MySQL and PostgreSQL support with two new data sources from big names: Google Analytics and Oracle RDBMS. To use either with Chartio, simply log into your account and spin up a new project or go to Settings>Add new data source within an existing project.
-data-sources-google-analytics-and-oracle/datasources.png)
Google Analytics
By connecting your Google Analytics account to Chartio, you can see your web analytics data in the same dashboards as your database. Rendered in the same interface, it’s easy to keep tabs on related trends, like how many visitors you have, how many conversions are happening, how much money that’s generating, and how many products you have in stock. And since Analytics connects to your Adwords data, you also get a gateway into your advertising spend in the same dashboard.
Get started by adding Google Analytics data to your current project.
Oracle RDBMS
With Oracle support, we’re broadening our database offerings and supporting the first of the big commercial databases. There are many tools for visualizing Oracle out there, but we think Chartio is the easiest and the prettiest, using the same connection methods as the other databases we support. We’re absolutely psyched that you can use Chartio to visualize Oracle DBs, whether they house your business data or the ‘earth saving analytics’ that power your Helicarrier.
As usual, we connect directly to both of these data sources and render charts directly from your data, so there’s no additional warehousing overhead, and consequently no additional lag. Chartio is as real-time as your data.
We’d love your feedback! Try Chartio out with your data, and let us know what you think by emailing us at hello@chartio.com.


