Data Munging Crowdsourced Information without SQL, Using Chartio's Data Stores
Posted by on August 28, 2015 Chartio,
Chartio is great for analyzing and reporting on data on your company’s systems, but what if you don’t have all the data you need to complete your analysis?
We recently held a joint demo with CrowdFlower to show how to crowdsource the information you need and analyze it in Chartio.
In this post, I’m going to explain how we collected the data and show you the analysis we performed that night.
I’m also going to show you how I used Chartio’s Data Stores to modify the structure of the data, so that I could analyze it further. This process is variously known as data munging, data wrangling, or data preparation. I’ll show you how even someone who has never used SQL can turn messy data into something more usable.
CrowdFlower Makes it Easier to Crowdsource Data
Crowdsourcing is not a new solution to the problem of data gathering. Amazon’s Mechanical Turk was introduced ten years ago, in 2005.
Mechanical Turk can be used for more projects than data gathering. It has been applied to finding missing persons (unsuccessfully), social science experiments (controversially), and art projects. It’s a good tool for gathering data, but it’s a challenging tool for non-experts to deploy. I’ve personally identified a couple of pet projects that could be done using Mechanical Turk, but I eventually moved on to other projects because setting up the tasks was too difficult.
Crowdflower focuses on a more limited problem set (data gathering) and solves it with a superior user interface. It’s a tool that a non-expert can use to collect the data they need for analytical projects.
What are the Genders of Startup Founders?
The audience for our demo were all working at startups, so we decided to analyze data about startups. We collected information about a set of startups and their founders, put that information into a database, and analyzed it in Chartio.
First, we created a list of startups. Then, we collected and layered in two additional data sets: company founders, and demographic information (gender, education, and previous company) about those founders.
As you watch the video, you can see that we were able to quickly collect a great deal of information about 6,000 companies and their founders for pennies per record.
For the demo, we produced a dashboard with some interesting information about the genders of company founders, as well as another dashboard that looked at previous employer and education of founders.
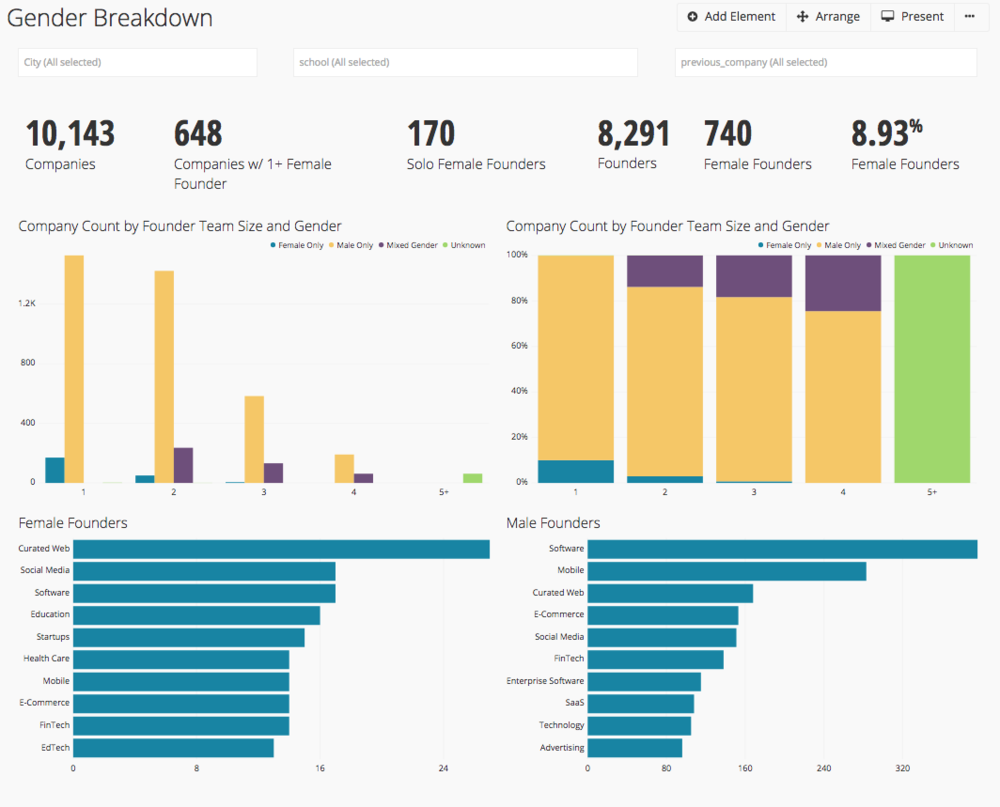
Chartio’s dashboard of the gender of startup founders
How to Re-Structure a Table in Your BI Tool … Without SQL
I decided that I wanted to further analyze the information about the genders of startup founders.
I was confronted with a common problem. The person who set up the project hadn’t given a lot of thought to how the data would be analyzed.
The data was organized by company, and not by founder. All the information about the founders was there, but it was extremely difficult, if not impossible, to analyze the founders as individuals without using a lot of SQL. There were four columns for founders (Founder 1 Name, Founder 2 Name, …), four columns for their respective college names (School 1, School 2, …), and so forth.
There are nearly 100 columns in the database:
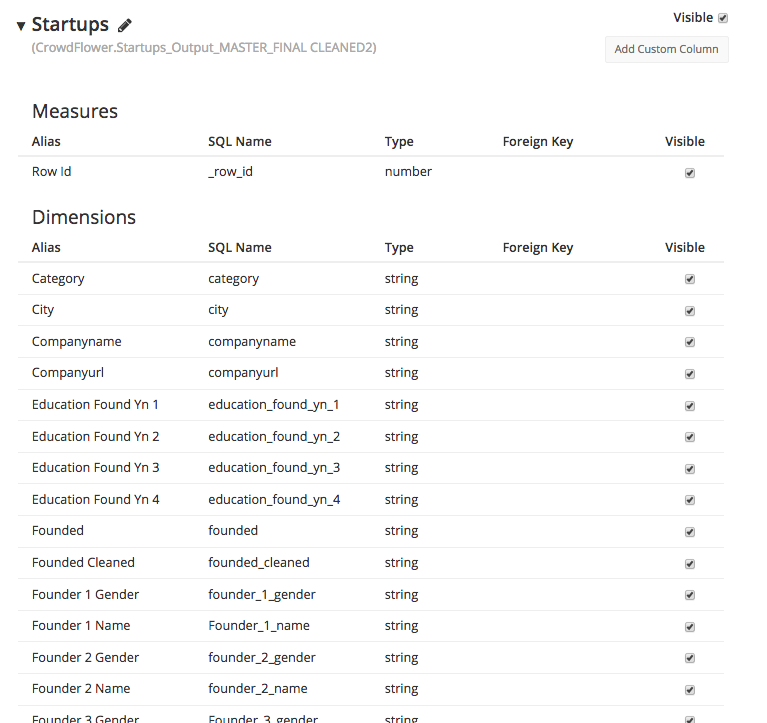
The data for each of four founders was stored in its own columns in the company table
It may have been possible to have collected the data in an easier-to-analyze fashion but, as the poet said, you do your analysis with the data you have, not the data you might want or wish to have at a later time.
Chartio’s SQL experts had finessed this problem by looking at the number of founders of each gender in a company using a SQL query. This allowed some analyses of the data, but it required a strong knowledge of SQL to build some fairly complex queries.
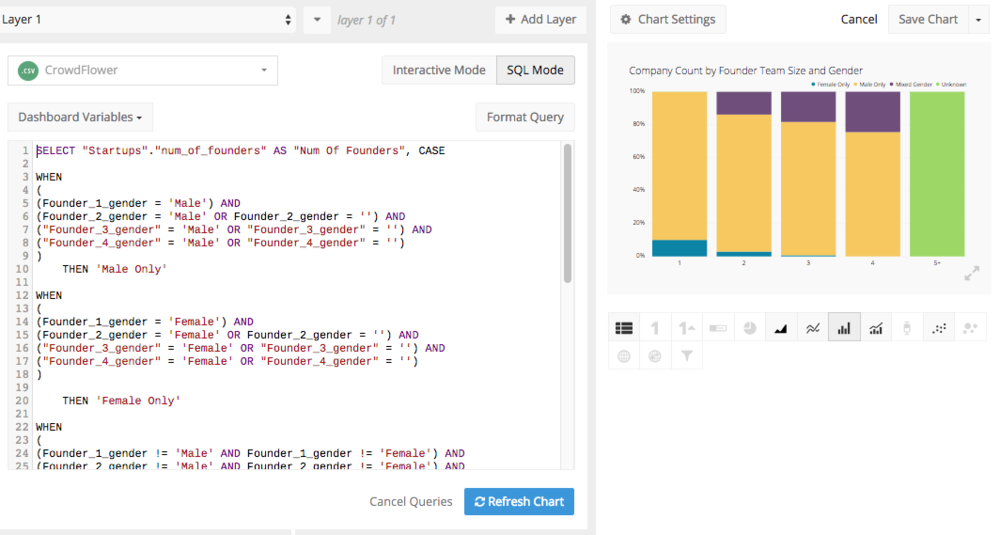
Chartio’s analysts analyzed the company data using SQL
I’m not a SQL user, but after spending some time with the data, I realized I could use Chartio’s Data Stores feature to restructure the table – without using any SQL. Data Stores allow you to use our drag-and-drop Interactive Mode to build a new table, stored in our cloud, which can be queried just like any other table on Chartio.
I needed to take our table, which had one row for each company, and create a new table with one row for each founder.
To create this table I built a new query with four layers, one layer for each company founder. I filtered out all the records in which the company URL or the Founder Name was blank. Then I joined the four layers using a Union and renamed the columns to reflect their new, more generic contents.
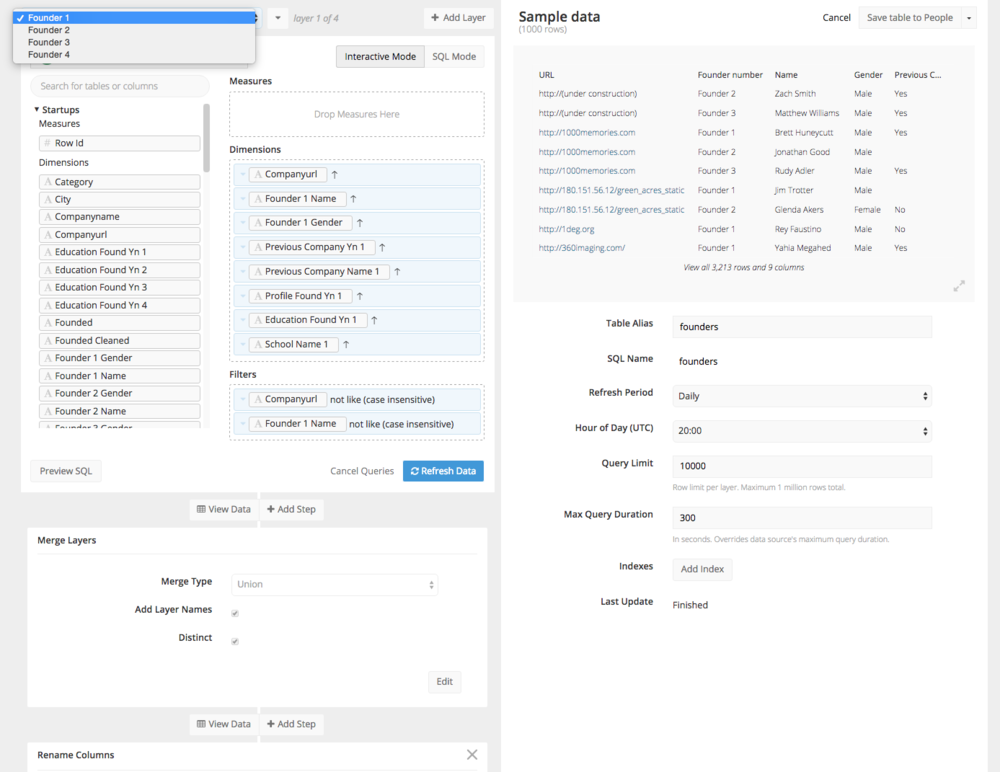
The first of four layers, which are joined using a Union to form the new Founders table.
Now I was ready to analyze the founders individually. This data set is not complete and is pretty noisy, so these results are not definitive.
I analyzed the gender breakdown of founders by category of startup. What I found was that women were a little less likely to be founders in the most popular categories of startups.
The categories (among the top 20) with the highest share of female founders were “Startups”, Curated Web, Education, Health Care, Ed Tech, and Health and Wellness.
The categories (among the top 20) with the lowest share of female founders were Software, Mobile, Enterprise Software, “Technology”, and Finance.
This suggests that women are more likely to be founders in fields that are traditionally more female-friendly. They are less likely to be founders of companies which define themselves primarily in terms of their technology, rather than their product.
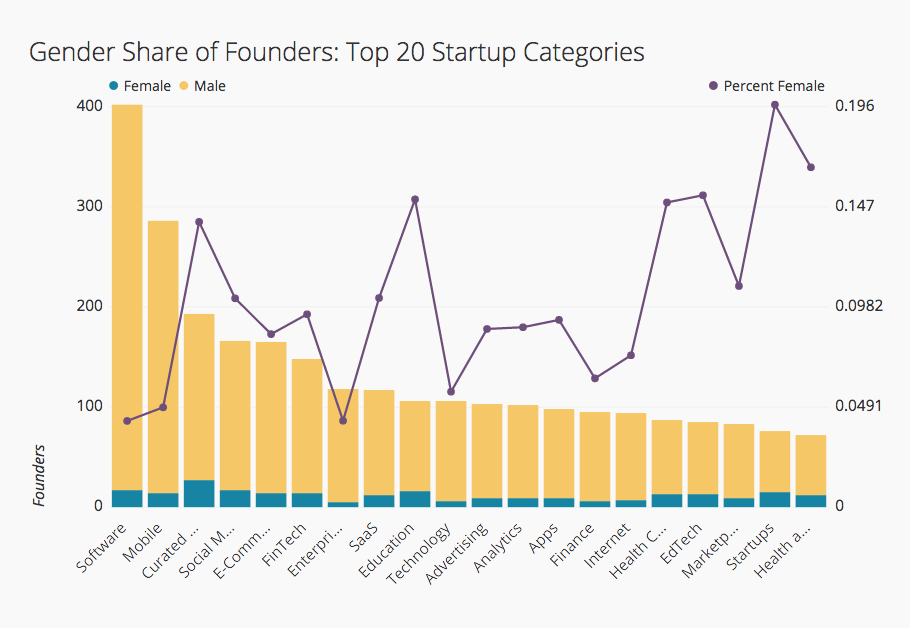
Number and share of female founders by startup category.
Data Wrangling for Marketing Majors
If you’re planning to crowdsource data, or to order data from a supplier, give some thought to how you’re going to analyze it before you place your order.
But, if you got it wrong, or you didn’t get a chance to specify the format of the data, it’s still possible to save your project. Chartio’s Data Stores give you significant opportunities to restructure your data, filter out noise, and prepare your data for analysis.


