It’s time for a summer review! For the past few quarters we’ve focused on two main themes: performance, and making Chartio more intuitive. Here are some of the biggest improvements we’ve released recently to support these goals..
Harder, Better, Faster, Stronger
As the song goes, “Work it harder, Make it better, Do it faster, Makes us stronger”—and that we did to bring you faster dashboards, better caching, and stronger governance to empower a democratized data team.
Improved Dashboard Loading
A couple of seconds might seem trivial, but it feels a lot longer when you’re waiting for something to load. This was the case when it came to dashboard loading on Chartio. Fortunately, we were able to save a few seconds by implementing a change with how we update dashboards, so you’ll now wait 1-2 seconds less for every dashboard load.
Extended Cache Duration (7 days)
The default max cache duration for any Chartio dashboard had been 24 hours, but now we’ve extended this max to 7 days. The extended cache duration will prevent unnecessary query refreshes which will help improve dashboard load. 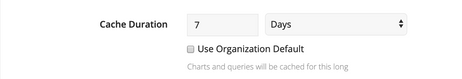
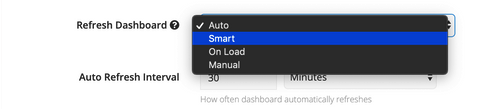
Smart Refresh
Alongside extended caching, we’ve also added a new refresh setting for your dashboards: Smart Refresh. Smart Refresh is the same as Auto, in which charts automatically refresh at a set interval, except new queries will not be triggered if the dashboard is in an inactive (not currently in view) browser tab. We found that about 70% of all auto-refresh queries take place in hidden/idle browser tabs. That’s a lot of unnecessary queries! Reducing the number of queries we send to your databases will help reduce rate limiting errors. Sending fewer unnecessary queries will also give you a performance bump and help you save on costs.
Behind the Scenes
We’re always striving to make Chartio easier and more intuitive to use. In case you missed it, here are some of the behind-the-scenes updates we’ve released to make things easier for you.
Preserving Dashboard Control Settings when Editing Charts
View, edit, and test your charts using the dashboard controls. Now when you’re viewing and editing charts, the dashboard control values will stay selected between the dashboard and the chart editor so you don’t lose context. You can also reset the variable values in the chart editor and have them selected when going back to the dashboard.
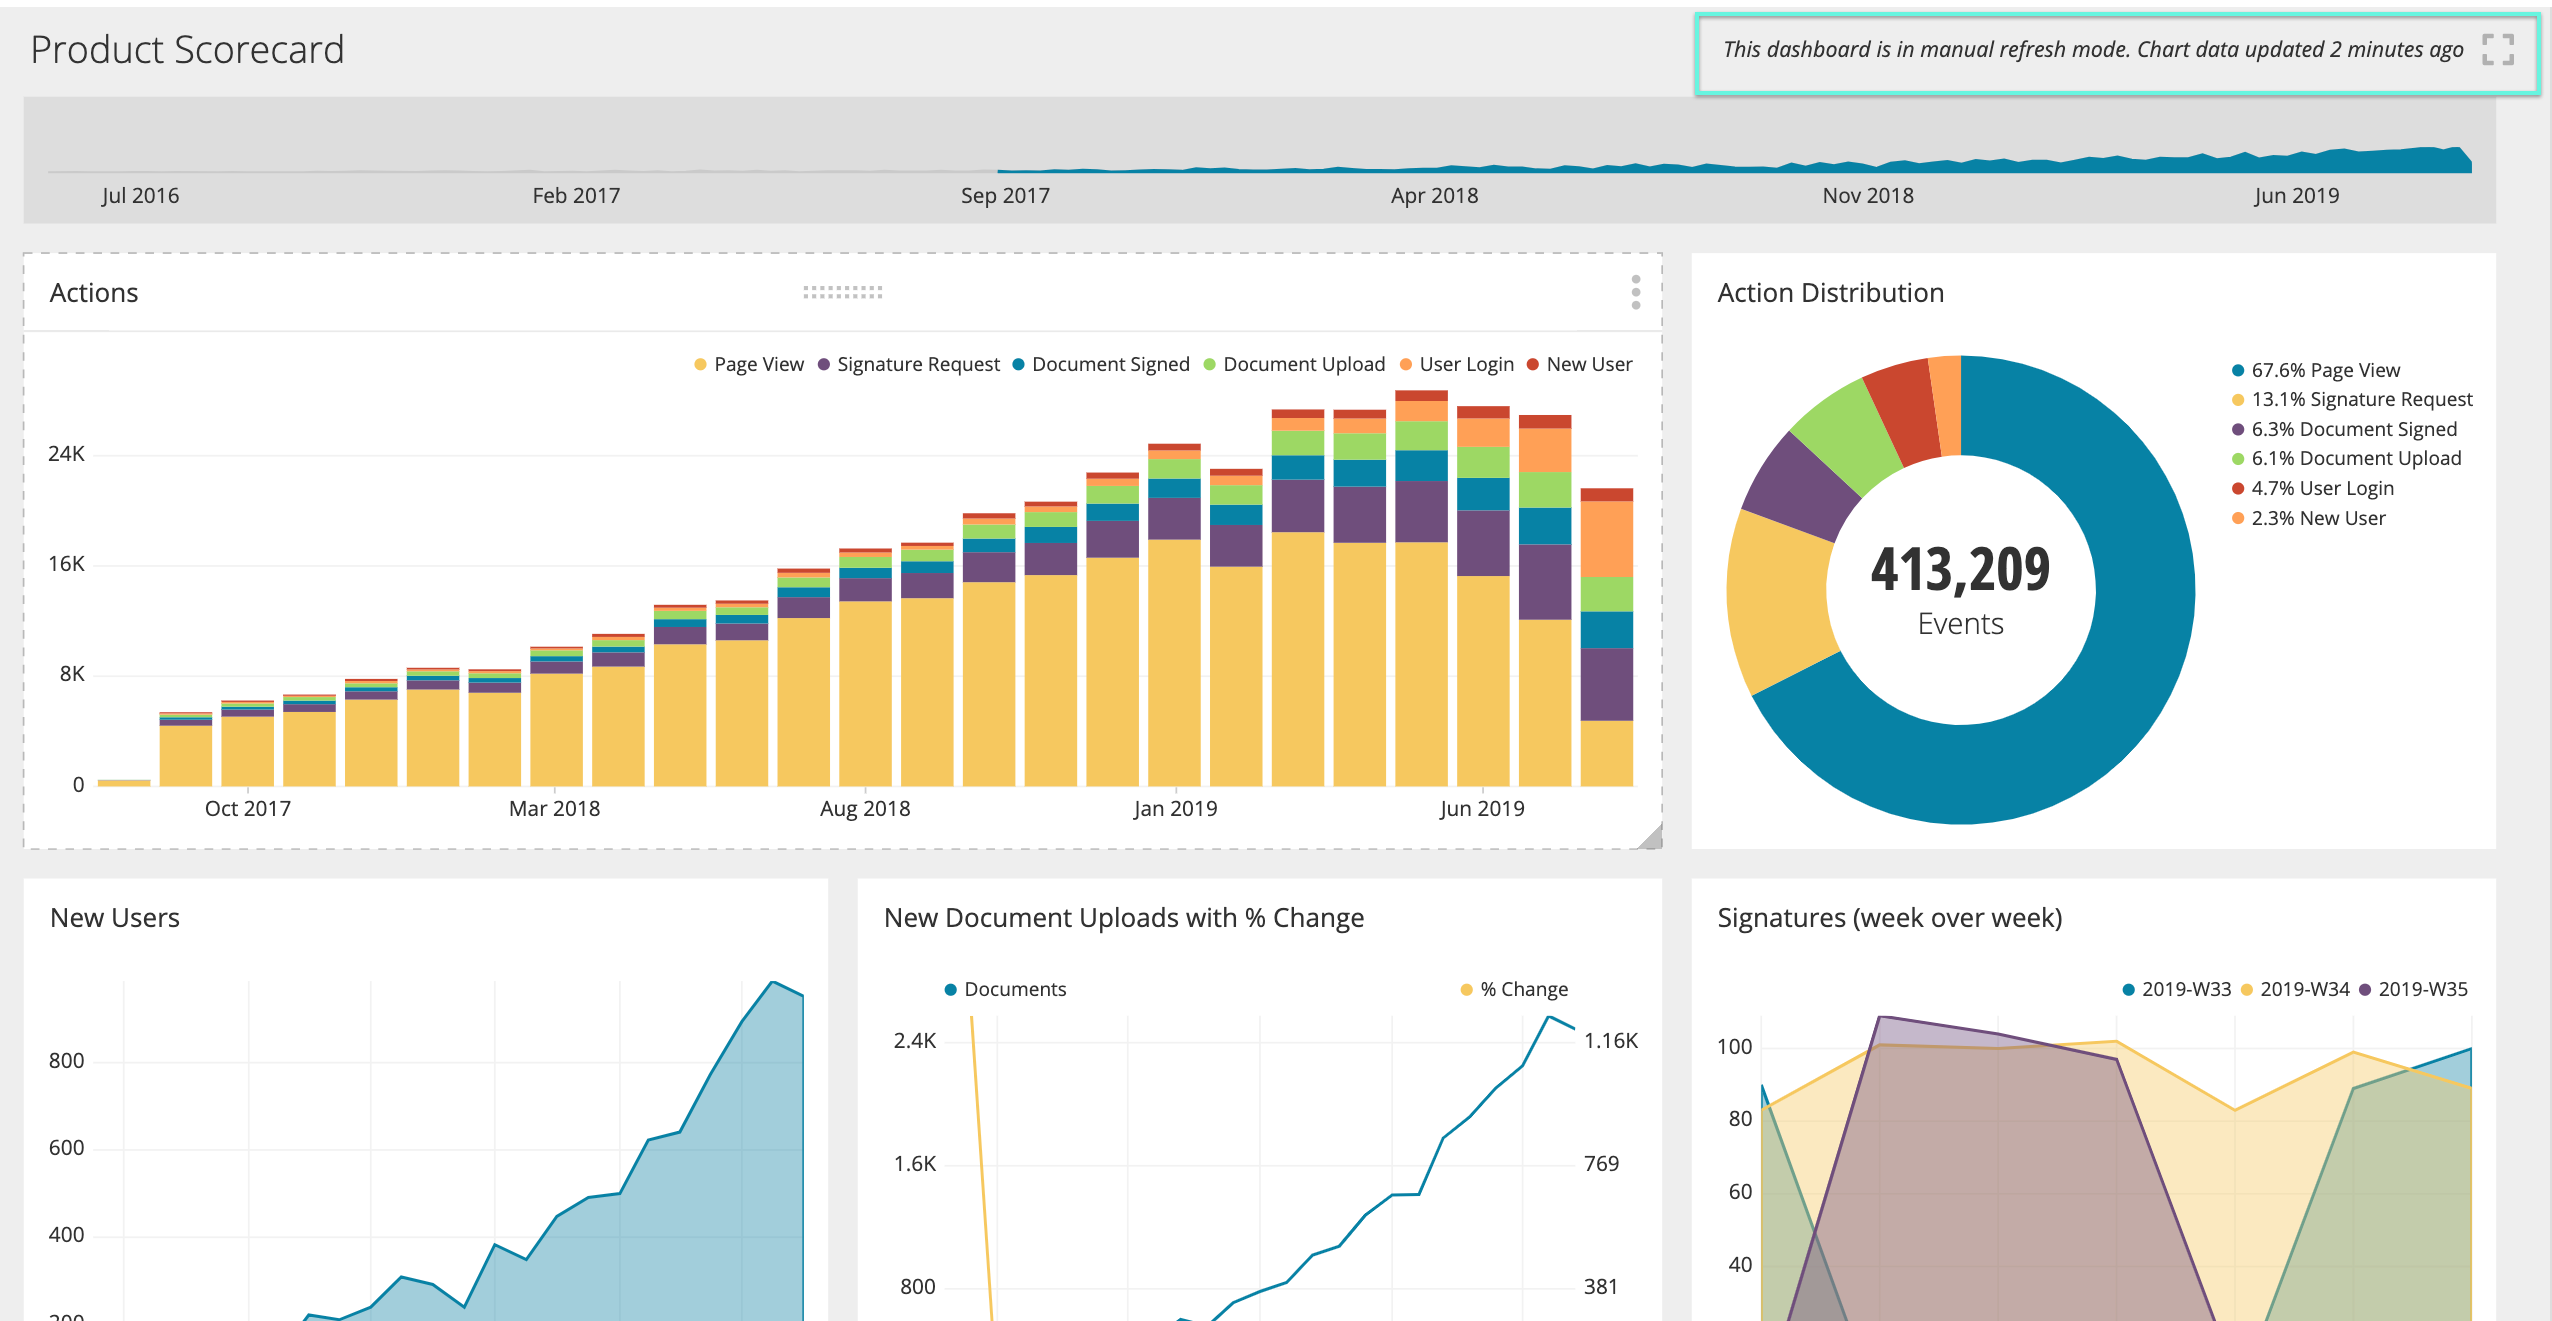
Show Cached Charts for Manual Refresh Dashboards
The Manual Refresh setting is useful to prevent queries from auto executing when the dashboard is loading. It helps to offload potentially long-running or expensive queries from executing until you need them. But until now, it was hard to tell which dashboard or charts you were loading, since there was no preview or cached version of the dashboard. We’ve now added the last run cached version of the dashboard as a way to preview which charts are on the dashboard before having to execute your queries.
Show Chart Titles on Dashboard When Loading
In addition to adding more context for manual refresh dashboards, we’ve added more context to all loading charts by displaying the chart titles first as the dashboard loads. That way, you can quickly find the chart you’re looking for by scanning the chart titles, even if the dashboard hasn’t finished loading yet.
Chart Loading based on Appearance
Keeping to the theme of dashboard loading, we’ve also improved the dashboard loading experience by having in-view charts load first. Dashboards can contain a number of charts that can result in very long dashboards.o help improve the loading experience, charts in-view now have priority loading, so you can spend less time waiting for your entire dashboard to load.
Multiple Schema Support for Athena and Snowflake
Since releasing our first support for multiple schemas last year, we’ve continued to expand our portfolio of databases with the addition of Athena and Snowflake. You can now reflect and query multiple schemas to create custom datasets across all your data.
Images on Dashboard
One of the most requested features in Chartio history is finally here: Images on Dashboards! This new feature joining the dashboard sidebar allows you to upload images and gifs to your dashboard. The possibilities are endless.
What’s Next?
As summer is winding down, we’ll continue to bring the heat 🔥with some exciting new releases we have planned. We want to continue this momentum going into Fall as we focus on addressing the problems of complexity and governance.
We’re also excited to announce that we’re HIPAA compliant! This has been the result of diligent work done by our amazing engineering team over the last few months to bring you a more secure Chartio. We’re continuing this work to bring you a better and more secure version of Chartio. Look out for our HIPAA blog post that will go over in detail all the new features available for your Chartio account to meet your compliance needs.
As always, we cannot thank our customers enough for helping and shaping Chartio as a product today. We’re always open to hearing your input so if you have feedback or feature requests, let us know at support@chartio.com.


