Once you have determined a day that has shown significant load on your WLM Queue, let’s break it down further to determine a time of the day. To do that we will need the results from the query we created in the previous tutorial.
The Query
The original query looked like this:
SELECT

	trunc(w.service_class_start_time) AS "Day",

	SUM(w.total_queue_time) / 1000000 AS "Total Queue Time",

	SUM(w.total_exec_time) / 1000000 AS "Total Exec Time",

	SUM(w.total_queue_time + w.total_exec_time) / 1000000 AS "Total Time",

	(SUM(w.total_queue_time)::FLOAT/ SUM(w.total_queue_time + w.total_exec_time)::FLOAT) AS "Percent WLM Queue Time"

FROM

	stl_wlm_query w

WHERE

	w.service_class = {SERVICE_CLASS}

	AND w.service_class_start_time BETWEEN {CALENDAR.START} AND {CALENDAR.END}

GROUP BY

	trunc(w.service_class_start_time)

ORDER BY

	trunc(w.service_class_start_time) desc
And it got us the following information:
- Day
- Total Queue Time
- Total Exec Time
- Total Time
- Percent WLM Queue Time
The resultant table it provided us is as follows:
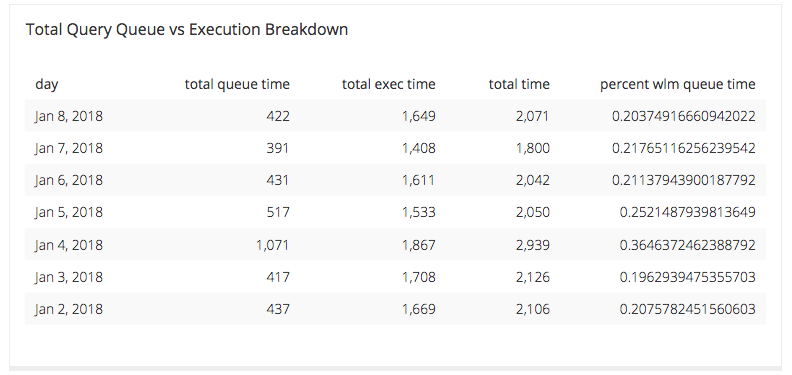
Now we can see that January 4 was a time of particular load issues for our data source in questions, so we can break down the query data a little bit further with another query. This query will have a similar output of 6 columns, and they are:
- Day
- Hour
- Total Queue Time
- Total Exec Time
- Total Time
- Percent WLM Queue Time
The Breakdown
- Hour
- This column is the hour during which the queries being analyzed were run.
- Total Queue Time
- This column shows the total amount of time queries during the given hour on the given day spent waiting for an available connection on the source being analyzed.
- Total Exec Time
- This column shows the total amount of time queries during the given hour on the given day spent executing against the data source.
- Total Time
- This column sums the previous two columns which will indicate how long it took for the queries on this source during the given hour on the given day to return results to you.
- Percent WLM Queue Time
- This columns breaks down how long your queries were spending in the WLM Queue during the given hour on the given day.
The New Query
SELECT

	(w.service_class_start_time)::DATE AS "Day",

	(date_part('hour', w.service_class_start_time))::INT as "Hour",

	(SUM(w.total_queue_time) / 1000000)::FLOAT AS "Total Queue Time",

	(SUM(w.total_exec_time) / 1000000)::FLOAT AS "Total Exec Time",

	(SUM(w.total_queue_time + w.total_exec_time))::FLOAT / 1000000 AS "Total Time",

	(SUM(w.total_queue_time)::FLOAT/ SUM(w.total_queue_time + w.total_exec_time)::FLOAT) AS "Percent WLM Queue Time"

FROM

	stl_wlm_query w

WHERE

	w.service_class = {SERVICE_CLASS}

	AND w.total_queue_time > 0

	AND (w.service_class_start_time)::DATE = '2018-01-04'

GROUP BY

	(w.service_class_start_time)::DATE,

	date_part('hour', w.service_class_start_time)

ORDER BY

	(w.service_class_start_time)::DATE,

	date_part('hour', w.service_class_start_time) asc
A Few Extra Notes
In the where clause of the original query, the date span is narrowed to a seven day span and that is to keep the load on the STL limited. In analyzing a particular source, keeping the analysis to around a week’s time is usually enough to make some diagnosis of a problem.
We now want to break down this date span to a single day and array it over the hours of that particular day. Therefore, in the where clause of this query ,we need to add in a date filter to only include 1/4/2018.
We also limit the service class in the where clause and this is because Amazon Redshift creates WLM query queues based on the service class. Amazon’s docs describe it this way:
“Amazon Redshift WLM creates query queues at runtime according to service classes, which define the configuration parameters for various types of queues, including internal system queues and user-accessible queues. From a user perspective, a user-accessible service class and a queue are functionally equivalent. For consistency, this documentation uses the term queue to mean a user-accessible service class as well as a runtime queue.”
Thus, when we limit the service class to a specific one, we can isolate that particular queue and leave out the other queues being created on this source as they do not necessarily impact each other here.