Once you have determined a day and an hour that has shown significant load on your WLM Queue, let’s break it down further to determine a specific query or a handful of queries that are adding significant burden on your queues. To do that we will need the results from the query we created in the previous tutorials.
The Query
The last query we created looked like this:
SELECT
(w.service_class_start_time)::DATE AS "Date",
(date_part('hour', w.service_class_start_time))::INT as "Hour",
(SUM(w.total_queue_time) / 1000000)::FLOAT AS "Total Queue Time",
(SUM(w.total_exec_time) / 1000000)::FLOAT AS "Total Exec Time",
(SUM(w.total_queue_time + w.total_exec_time))::FLOAT / 1000000 AS "Total Time",
(SUM(w.total_queue_time)::FLOAT/ SUM(w.total_queue_time + w.total_exec_time)::FLOAT) AS "Percent WLM Queue Time"
FROM
stl_wlm_query w
WHERE
w.service_class = {SERVICE_CLASS}
AND w.total_queue_time > 0
AND (w.service_class_start_time)::DATE = ‘2018-01-04’
GROUP BY
(w.service_class_start_time)::DATE,
date_part('hour', w.service_class_start_time)
ORDER BY
(w.service_class_start_time)::DATE,
date_part('hour', w.service_class_start_time) asc
And it got us the following information:
- Day
- Hour
- Total Queue Time
- Total Exec Time
- Total Time
- Percent WLM Queue Time
The resultant table it provided us is as follows:
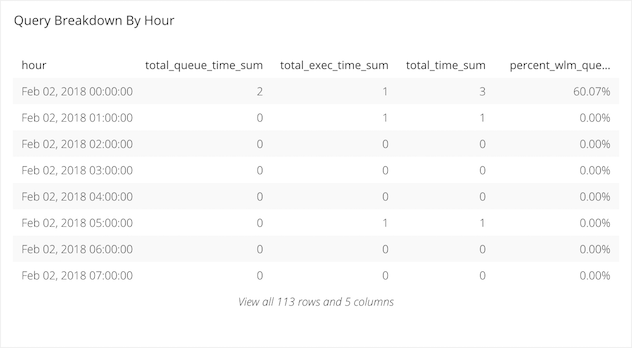
Now we can see that 21:00 hours was a time of particular load issues for our data source in questions, so we can break down the query data a little bit further with another query. This query will have a similar output of the 6 columns from before plus a few additional columns. All of the columns in the new table are:
- Query ID
- Query Text
- Date
- Hour
- Total Queue Time
- Total Exec Time
- Total Time
- Percent WLM Queue Time
The Breakdown
-
Query ID: This is the identifying number your datasource will assign this query at the time of it’s running.
-
Query Text: We have pulled out and displayed the first 50 characters in the actual query in question. This can be used by you to identify the query itself from your logs.
-
Date: This column is the date on which the queries being analyzed were run.
-
Hour: This column is the hour during which the queries being analyzed were run.
-
Total Queue Time: This column shows the total amount of time queries during the given hour on the given day spent waiting for an available connection on the source being analyzed.
-
Total Exec Time: This column shows the total amount of time queries during the given hour on the given day spent executing against the data source.
-
Total Time: This column sums the previous two columns which will indicate how long it took for the queries on this source during the given hour on the given day to return results to you.
-
Percent WLM Queue Time: This columns breaks down how long your queries were spending in the WLM Queue during the given hour on the given day.
The Next Query
SELECT
w.query "Query ID",
SUBSTRING(q.querytxt,1,50) AS "Query Text",
(w.service_class_start_time)::DATE AS "Date",
(date_part('hour', w.service_class_start_time))::INT as "Hour",
(w.total_queue_time / 1000000)::FLOAT AS "Queue Time",
(w.total_exec_time / 1000000)::FLOAT AS "Exec TIme",
(w.total_queue_time + w.total_exec_time)::FLOAT / 1000000 AS "Total Time",
(w.total_queue_time::float / (w.total_queue_time + w.total_exec_time))::FLOAT AS "Percent WLM Queue Time"
FROM
stl_wlm_query w
LEFT JOIN
	stl_query q
         	ON q.query = w.query
        	AND q.userid = w.userid
WHERE
w.service_class = {SERVICE_CLASS}
AND (w.queue_start_time)::DATE between {CALENDAR.START} AND {CALENDAR.END.SUB(1,'days')}
AND (w.service_class_start_time)::DATE between {CALENDAR.START} AND {CALENDAR.END.SUB(1,'days')}
AND w.total_queue_time > 0
AND w.userid > 1
AND date_part('hour', w.service_class_start_time) = {HOUR}
ORDER BY
(w.service_class_start_time)::DATE DESC,
(date_part('hour', w.service_class_start_time))::INT ASC