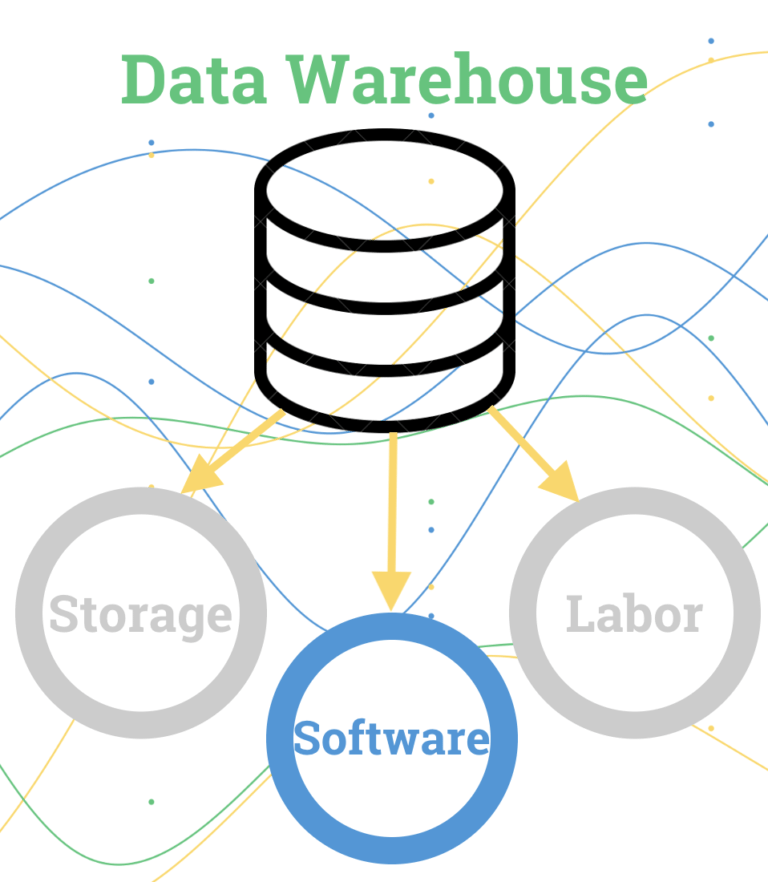
In our Data School tutorial “Basics of Building a Data Warehouse”, we identify the benefits of using a data warehouse and introduce the basic structure needed to build one. The structure consists of three different components: a storage mechanism, operational software, and human resources. In this tutorial, we’ll break down the software aspect of a data warehouse.
Software is the operational part of the data warehouse structure. It’s often broken down into two categories — centralization software and visualization software. The software needed to run a data warehouse doesn’t come with your chosen storage method, so licenses must be purchased for both groups of software. Some centralization software includes visualization software as part of its package, but it’s highly recommended that you have both types of software regardless. Let’s further discuss centralization and visualization software, including some benefits of each type and a few product examples.
Centralization Software
Centralization software is needed to collect and maintain the data that comes from all of your separate databases. There are many advantages to controlling your data in one space, including:
- Improved data security – data scattered on several machines increases the number of ways that intruders can take your business’s information; protecting a central server is much easier and effective.
- Ease of access – central storage allows for quick and easy access to important data from almost anywhere in the world.
- Increased overall workflow – increased mobility and control of data can boost the overall effectiveness of the workflow.
- Cost effectiveness – storing and backing up data on multiple machines is expensive and requires a lot of extra work; it’s less costly to use central storage.
Most centralization software is called Extract, Transform, Load (ETL) software. There are many options when it comes to ETL software, but they all should incorporate popular database types and SaaS platforms into your data warehouse. We’ve listed a few software options below, along with their basic features:
| Panoply | FlyData | Funnel | |
|
|
|
Visualization Software
Visualization software is used to process the centralized data and present it in a visual form to aid in analysis. Visualizations provide many benefits for businesses including:
- Faster processing – humans are naturally more suited to process visual cues rather than writing; patterns are more easily recognizable and visuals allow us to quickly understand important information.
- Deeper insights – visualizations enable you to see connections between multi-dimensional data sets and provide new ways to interpret data through many forms of rich graphical representations.
- Identifying actionable items – visualization helps your organization see where there’s room for improvement or where performance is high; actionable items result in identifying successes and areas for improvement.
- Increased productivity – software saves time by automatically creating up-to-date reports and allowing anyone to understand information without help from experts, ultimately leading to greater productivity.
Some businesses use open-source visualization, but it’s a good idea to invest in a data visualization service to have consistency and a more automated workflow for your business. Just like ETL software, there are many choices when it comes to data visualization software, and we’ve provided some options and their basic features:
| Software | Chartio | Domo | Klipfolio |
| Basic Features |
|
|
|
Since there are so many options when it comes to centralization and visualization software, it’s hard to put an exact number on how much software will cost you overall. Price depends on several factors including the number of users, size of the database, and number of licenses you need.
Conclusion
Once you’ve selected the best storage method for your data warehouse (read more here), it’s important to choose software that makes your warehouse operational. For a fully functional and easy to use data warehouse, it’s important to have centralization software as well as visualization software. The centralization software is essential for collecting and maintaining all of your data in one place, and the visualization software is used to turn that data into helpful visual aids for analysis. There are many options when it comes to both types of software, so it’s important to do research and keep in mind your business’s needs before you make a decision.