Utilizing stats tables in PostgreSQL, you can monitor the number of live and dead rows, also referred to as tuples, in the table. Live rows are the rows in your table that are currently in use and can be queried in Chartio to reference and analyze data. Dead rows are deleted rows that have had their data removed and are slated to be reused by your datasource when you use a write command like INSERT or UPDATE.
Note - Chartio’s connection to your data source should be read-only in order to prevent any malicious or unintended writing to your source. Also, certain commands aren’t allowed in Chartio’s query builder so as to prevent these commands from being sent to your source by Chartio.
Now, for the statistics query you will be using. We will be sending a query to the Postgres States User Tables (pg_stat_user_tables), which is a diagnostic statistics table that Postgres keeps on your sources (as long as you have the proper configuration settings). There are myriad of statistics that can be used on your source.
For our purposes here we will be analyzing the live and dead tuples, using the following query:
select relname, n_live_tup, n_dead_tup
from pg_stat_user_tables
group by 1, 2, 3
order by 2, 3 desc
Let’s break the columns down:
relname = the name of the table in question
n_live_tup = the approximate number of live rows
n_dead_tup = the approximate number of dead rows
Now let’s see it in practice.
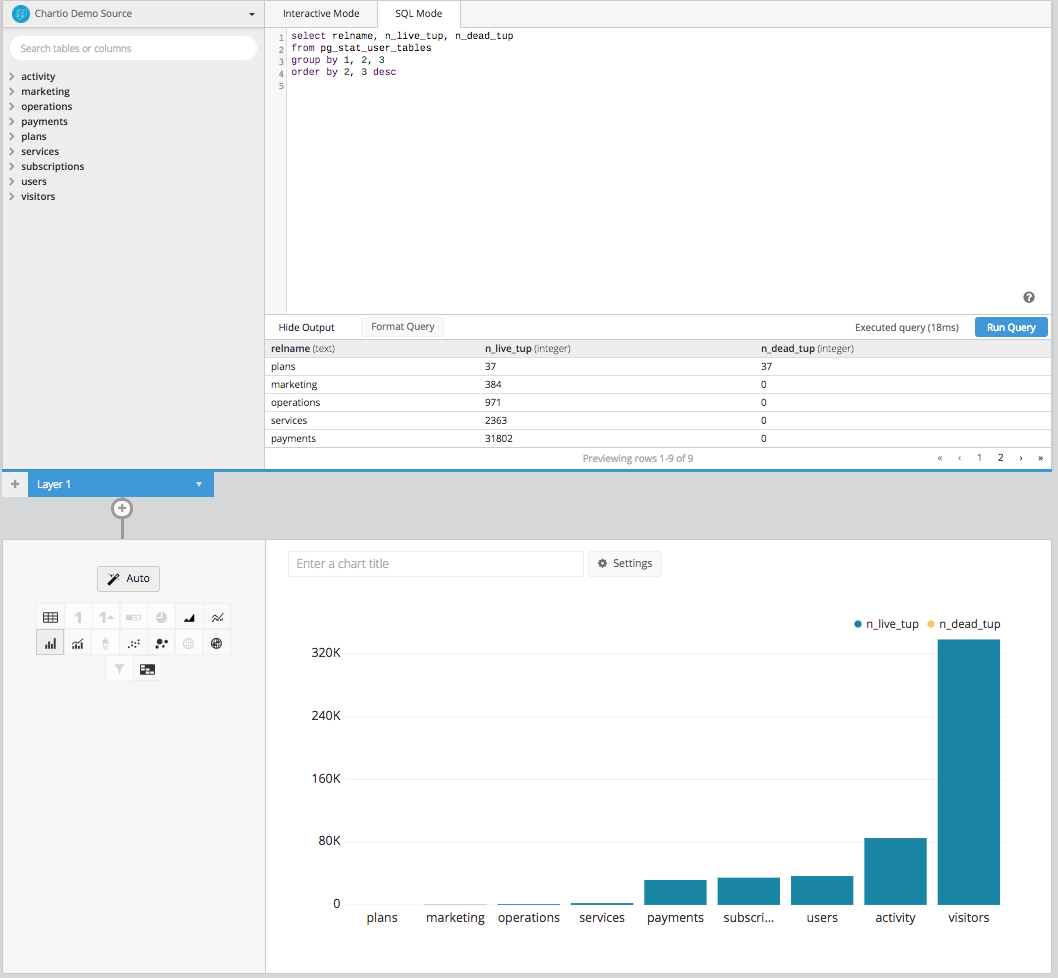
You can go to the Chartio Data Explorer in explore mode and select the data source you’d like to analyze. In the example below, I am using the Chartio Demo Source which your organization was linked to when you signed up with Chartio. Then, I can just copy and paste the SQL query above and run it against data source. You can see by the resulting bar chart, that there are no dead rows in these tables and that the visitors table has the most live rows.
Using this diagnostic query you will be able to monitor your sources and their statistics, regularly. I might even suggest using this query and others like it to build a monitoring dashboard that could help you monitor your sources and their statistics at a glance, and even set up a report that can be sent to you every morning to keep a watchful eye on your sources.