The first thing to understand about R is the importance of devices, which represent graphical devices that are currently active and available for use in graphical representation.
Typically, if the user doesn’t specify a default device to use, for *nix-based systems with no screen device, R will default to using the pdf() graphical device. In other words, when file output is processed on *nix systems, a .pdf file is created to house the output of the session (such as a plotted graph).
Manipulating Devices
To see devices in action, open a standard R prompt. Many of the manipulation methods for devices use the dev object. For example, we can view the current list of active devices for this session (since it was just launched, it will likely be empty or NULL):
> dev.list()
NULL
To add a new device, call the dev.new() method:
> dev.new()
dev.new(): using pdf(file="Rplots1.pdf")
This will instantiate a new device for the session and use the default device type (in this case on a *nix machine, it defaults to pdf and thus shows the device call and file that has been created).
Now checking the device list, we now see our new pdf device listed:
> dev.list()
pdf
  2
Output a File to Disk
Now with a basic understanding of how graphical devices are instantiated in R, we can actually create output for our plot quite easily.
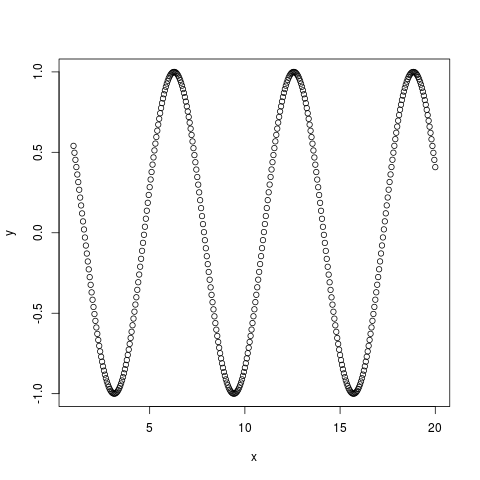
We start by creating a simple plot. In this case, we’ll plot a number of points on a cosine graph:
# run.R
dev.new()

x <- seq(1, 20, 0.05)
y <- cos(x)
plot(x,y)

dev.off()
Our run.R script file is basic. We start by creating a new device with dev.new() (although as discussed before, this is optional as R will create a new device for you if necessary).
We then create some variables that store our vectors for x and y, then pass them to the plot() function to create our graph.
Finally, and most importantly when a file output is desired, we call the dev.off() method. This causes the current graphic device to be shutdown, thereby producing an output on the active device.
Thus for our case, when running our run.R script, R creates a new default device (pdf) and generates the output of our plot() call within that pdf file:
$ Rscript run.R
dev.new(): using pdf(file="Rplots1.pdf")
null device
          1
Sure enough, we see a nice pretty graph in the Rplots1.pdf file that was generated.
Modifying the Output File Type
There are a variety of device types available by default (pdf, postscript, bitmap, etc), and often depending on the installation of R, additional graphical formats are also included (png, svg, jpeg, etc).
As we saw from the output above issuing the dev.new() method call, R actually invoked the pdf() function to create that new device for us. This syntax is the same for other device types as well.
Therefore, if we wish to output to a different file type, we can simply modify the first line of our run.R script to invoke a different device type, such as png() or jpeg():
# run.R
png(file="plot.png") # Using png device instead of pdf default

x <- seq(1, 20, 0.05)
y <- cos(x)
plot(x,y)

dev.off()
Now after executing our script…
$ Rscript run.R
null device
          1
…a nice new plot.png file is created with our plotted graph on there!