Cohort Analysis Brings Valuable Insights to Marketing
Posted by on May 7, 2014 Education, Data Analytics
Cohort analysis is a powerful tool for visualizing actionable metrics that is easily performed using Chartio. Marketing teams may want to find out how a campaign is doing, but also which campaign is bringing in the right customers for the longest amount of time. Cohort analysis can help answer these questions. Read on to learn more.
A cohort is usually defined as a group of people that share a common characteristic and cohort analysis is a method of comparing behavior between cohorts of users.
We’ve created an example dataset to walk you through some examples of cohort analysis.
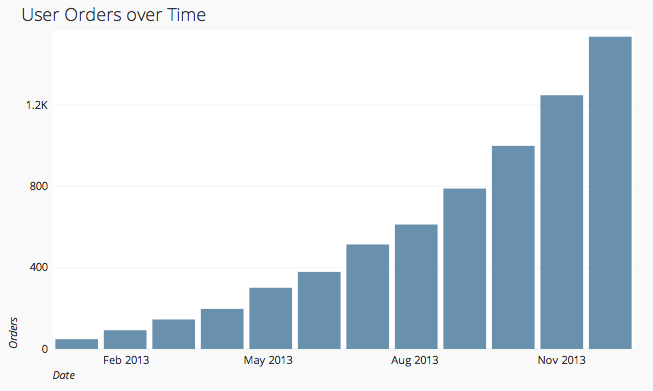
Before examining the cohorts, let’s simply look at our user orders over time. We see that over time our example company is garnishing more and more orders. This is great but it doesn’t tell us anything about who our users are - or which users are placing orders. We can see that more orders are being placed but we don’t know how or why.
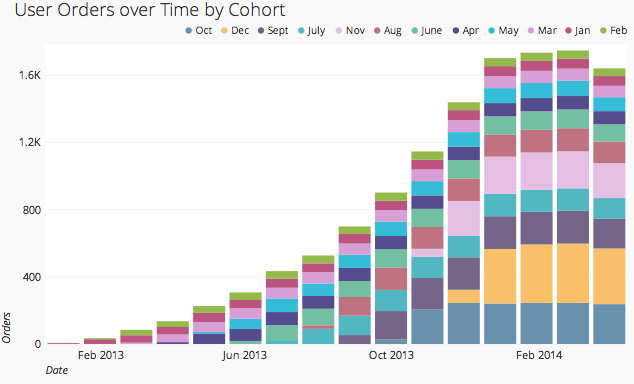
Lets look at the same information, orders over time - but now by cohort group. In this case we are defining our cohorts by the month the user was created. Now we can see how the cohorts are ordering over time. We see that the number of orders increases at first, but then starts to drop off.
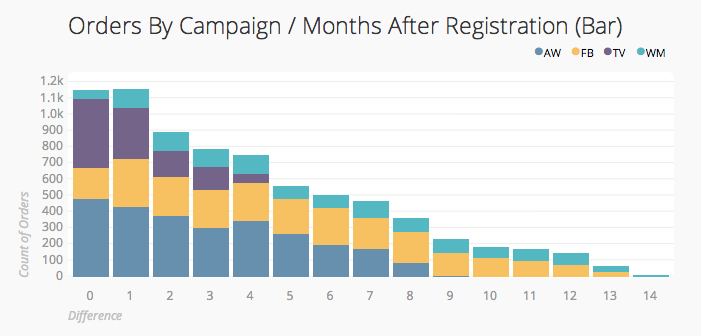
But still we want to know what users are placing orders - which are recurring customers? Instead, let’s try examining the cohorts by the marketing campaign that brought them in - and see how they behave over time. This will let us know not only how users behave over time, but what marketing campaigns are more effective.
To perform this analysis we are looking at the number of orders placed per month after registration, grouped by marketing campaign - which is a more advanced cohort analysis. This tells us exactly what campaigns are most effective for long-term retainment, and we can see that although the TV campaign brings in more users at first, those users quickly drop-off. The other marketing campaigns are actually more effective at keeping users.
This cohort analysis can be performed rather simply using a MySQL query [note: this walk-through assumes some knowledge of SQL - refer to the following page for more in-depth instructions.
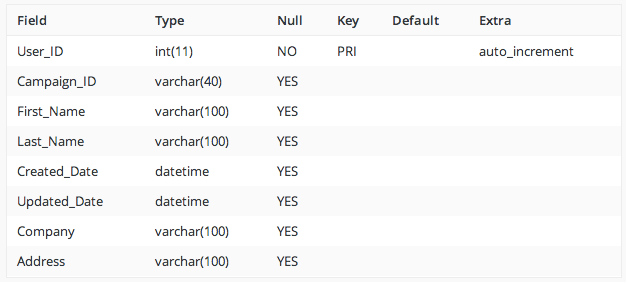
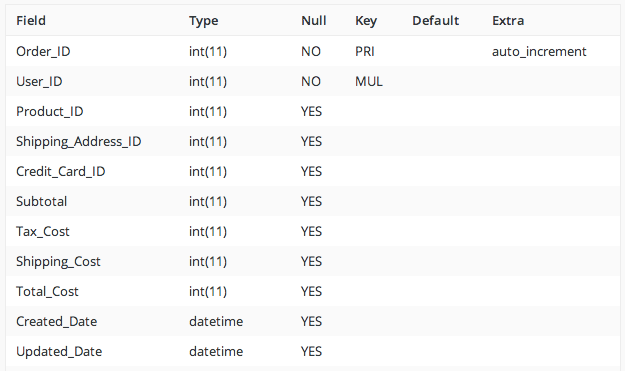
We are starting out with two tables - Users and Orders. These tables will contain all the information we need to build our query and our cohort analysis.
DESCRIBE Users;
DESCRIBE Orders;
To build this query, let’s segment it out into four sections:
-
Determining the number of orders placed
-
Selecting for the campaign, and joining the tables
-
Finding the difference in months between when the order was placed and when the user was created
-
Grouping and ordering the columns
To determine the number of orders placed, we are selecting for the Order_ID column from the Orders table, but also performing a function to find the number of distinct orders. Our SELECT statement will look like this:
SELECT
COUNT(DISTINCT Orders.Order_ID) AS `Count of Orders`
FROM Orders AS Orders;
Now to also determine the campaign, we are selecting for the Campaign_ID column, from the Users table. Because this column comes from a different table, we have to perform a join. Each table contains a User_ID column, so we will join the tables with that column.
SELECT
COUNT(DISTINCT Orders.Order_ID) AS `Count of Orders`,
Users.Campaign_ID AS `Campaign ID`
FROM Orders AS Orders
JOIN Users AS Users ON Orders.User_ID = Users.User_ID;
To determine the difference in months from the order date and the user’s creation date, we are looking at the Created_Date from the orders table, and the Created_Date from the Users table. We can use the PERIOD_DIFF function to find the difference in time between these values, but we also need to use the DATE_FORMAT function to put both our dates in the same format. We have already joined our tables, so all we need to do is add the selection for the date query.
SELECT
COUNT(DISTINCT Orders.Order_ID) AS `Count of Orders`,
PERIOD_DIFF(DATE_FORMAT(Orders.Created_Date, '%Y%m'),
DATE_FORMAT(Users.Created_Date, '%Y%m')) AS `Difference In Months`,
Users.Campaign_ID AS `Campaign ID`
FROM Orders AS Orders
JOIN Users AS Users ON Orders.User_ID = Users.User_ID
Lastly, we’re going to make sure we are grouping by the correct column, the ‘Difference in Months’ and the ‘Campaign ID’. Additionally we would like to see the ‘Difference in Months’ in ascending order.
SELECT
COUNT(DISTINCT Orders.Order_ID) AS `Count of Orders`,
PERIOD_DIFF(DATE_FORMAT(Orders.Created_Date, '%Y%m'),
DATE_FORMAT(Users.Created_Date, '%Y%m')) AS `Difference In Months`,
Users.Campaign_ID AS `Campaign ID`
FROM Orders AS Orders
JOIN Users AS Users ON Orders.User_ID = Users.User_ID
GROUP BY `Difference In Months`, `Campaign ID`
ORDER BY `Difference In Months` ASC;
The result of this query can be viewed as a table, or a chart for better visualization.
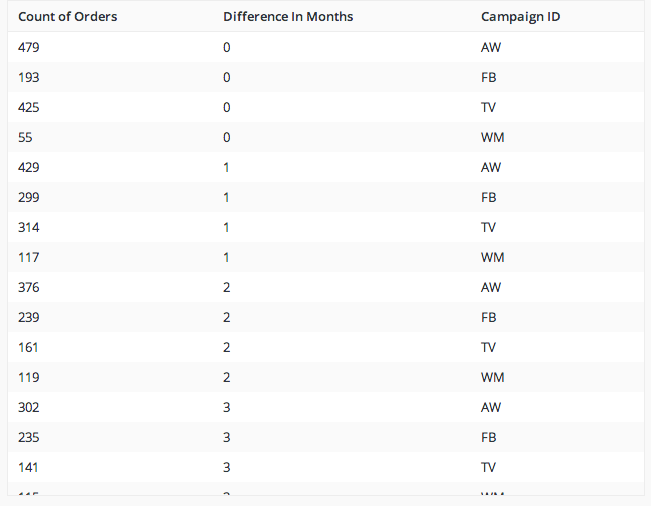
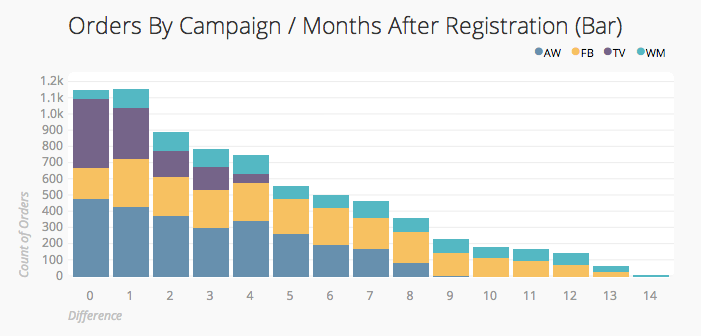
As shown above, the Facebook (FB) and word-of-mouth (WM) campaigns are most effective because although they bring in less users - these users stick around! We have provided more in-depth step-by-step instructions for recreating this query - you can do this entirely inside the Chartio query mode! As always, if you have any questions reach out to support@chartio.com and we can help you get your cohort analysis set up!


