Build a Modern Data Analytics Stack in Under an Hour with dbt and Chartio
Posted by on November 23, 2020 Chartio, Data Analytics
Connecting Chartio to your raw data without a proper data tech stack underneath is doable, but there is so much more power in connecting it to a modern data stack.
Creating a modern data stack may sound complicated, but we wanted to show you that it’s really not. The infrastructure is the easy part. (The hard part is always finding the perfect insights into your data). We created a modern, enterprise-grade, scalable data stack with Snowflake, Fivetran, dbt, and Chartio in under an hour.
What makes up a modern data stack?
Choosing the right technologies in your stack is essential. Let’s discuss each layer of the stack separately:
Data Warehouse: We always recommend going with a cloud data warehouse. This lets you start small with pay-as-you-go pricing, not have to worry about scalability and availability, and focus on the queries. Our favorites are Snowflake and Google BigQuery.
Extract and Load: We see Fivetran emerging as the gold standard for extract and load for BI analytics because of the large number of connectors and the simplicity of their interface, not to mention their ability to get around firewalls with SSH tunneling.
Data Modeling: Many customers turn to proprietary modeling languages to describe their models, but all you really need is some SQL and a tool called dbt. dbt is currently one of the hottest technologies in analytics right now. You needn’t look any further than their recent $29.5M fundraise or their frenetic Slack channel to see the energy around this product. And it’s not surprising why.
dbt is both an open source technology and an inexpensive cloud service. Any analyst that can write SQL can create models directly in the warehouse. You can also model dependencies between tables and create assertions to check dependencies between models, among many other things. You can quickly iterate on your models and your changes get source controlled in a Git repository.
Data Visualization and Dashboards: Once you have a clean data model, it’s easier to create visualizations because users are able to explore your data in a way that is logical for your business. And importantly, your model will make sense to your users (because you designed it that way). One powerful combination is using Chartio and dbt together. Chartio not only creates gorgeous, pixel-perfect dashboards, but it also provides a visual interface on top of SQL, known as Visual SQL.

Embracing “analytics engineering” in dbt means your team will be able to build in Chartio faster, see better performance, and have greater confidence that your data is accurate.
So why build a modern data stack?
Chartio’s Visual SQL solution allows anyone — analysts and non-analysts alike — to simply drag and drop their way to powerful dashboards. But we have to ask ourselves: what should they be dragging and what should they be dropping?
In order to make the most out of Chartio’s Visual SQL, you should take control of the tables and columns a user interacts with by designing a unified data model that makes sense for your business. This is essential because it unlocks and democratizes that data. In other words, your data will be easy to query and explore by everyone including non-technical users.
When it comes to designing a data stack, new customers often focus on moving data into a data warehouse and connecting a visualization tool to create dashboards. But we recommend to all of our customers that they start thinking about their data model first before designing their data stack.
It’s a common problem. Data flows from a number of sources, such a production database, advertising, CRM, and other sources into your data warehouse. In order to visualize useful insights across all this data, these sources all need to come together, but where? Many visualization tools, including Chartio, allow you to join multiple sources. But modeling is more than joining data sources, it’s about connecting data in a way that expresses possibilities rather than answers.
On the surface, designing a data model is easy. You need to define a set of physical tables that represent the logical aspects of your business data. After you have these tables defined, you need a way to transform and combine raw data tables into this model. In the end, your data analytics stack is made up of your data sources, a tool that can extract and load these sources into a data warehouse, a tool that can transform that data into your data model, and your visualization/dashboard tool.
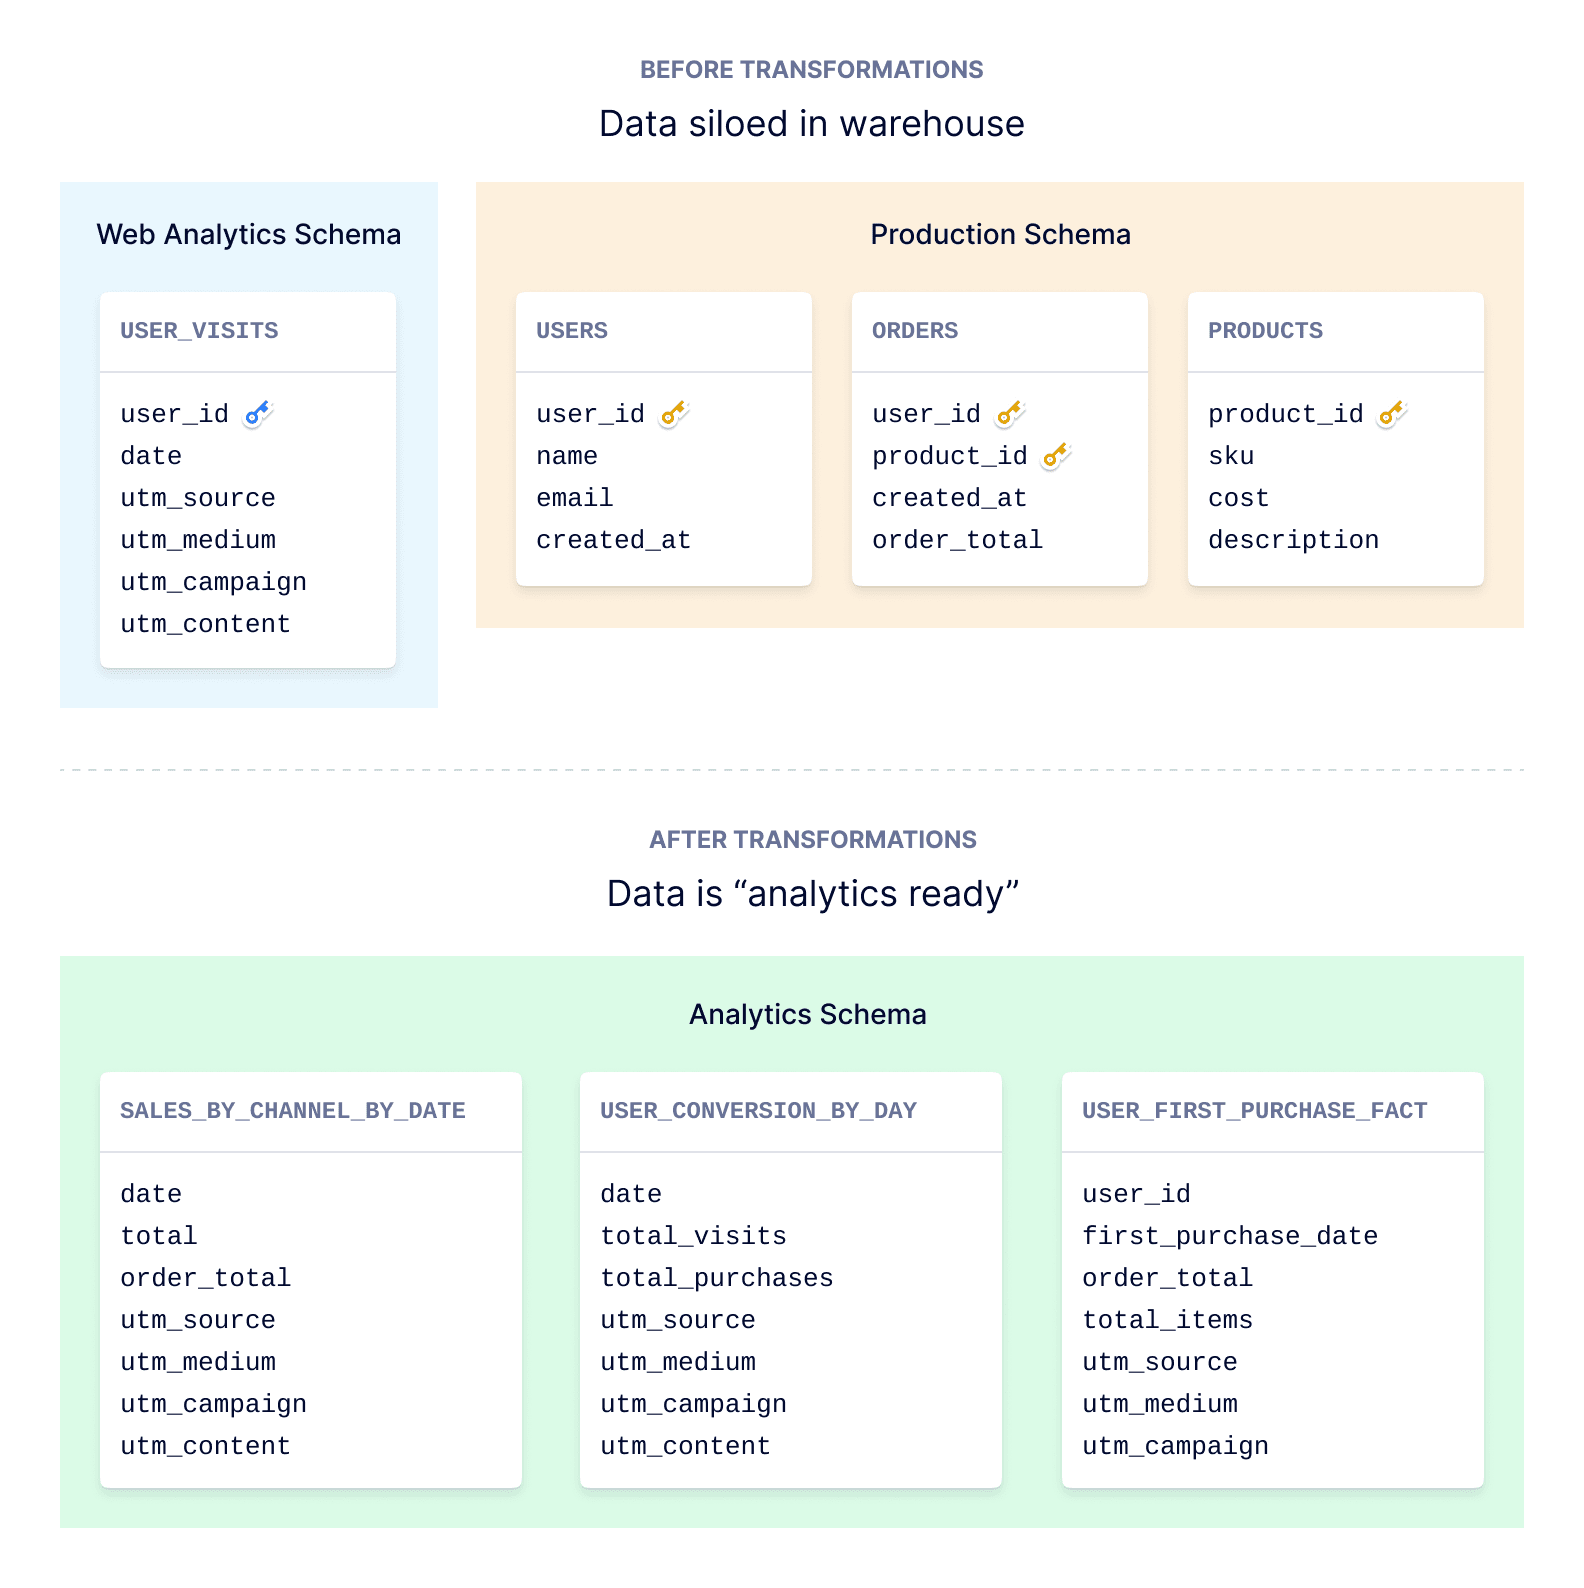
If you think about it, dbt materializes tables that are easier to query because they have been transformed for analytics already. Oftentimes you use dbt to create a schema that separates dimensions from facts or summarizes data in just the right way. Chartio’s Visual SQL interface compliments this perfectly by providing a way to explore your models in a simple drag-and-drop way.
 Build logic in dbt, run “dbt run” and your new tables show up automatically in Chartio.
As you iterate on your models in dbt, you can refresh them in Chartio and instantly take advantage of new aspects of your model. It’s a very powerful combination.
About Hashpath
Hashpath is a full-service data analytics consulting firm providing a complete range of services including data product-management-as-a-service, warehouse architecture, data pipelining, data sharing, and data application development. Hashpath is a small team of dedicated data analysts and engineers, working quickly and efficiently to help you reduce the time-to-value of your business intelligence projects.


