Creating a Powerful Data Analytics Stack: Blendo + Chartio
Posted by on February 22, 2017 Data, Data Stack, Data Analytics
Data is a crucial part of your business, no matter the size or purpose of your company. To get smart business insights and make data-driven business decisions, you’ll need to combine various data sources from product, marketing, sales and customer service. In order to bring all that disparate data into one place, your company needs to make a large effort to build its data and analytics infrastructure.
That is a two part procedure: first, you need a service that will gather data into your data warehouse, in the right form, from a multitude of sources and with the least effort possible. And second, you need a service that will help you connect these dots.
The “All Data in One Place” Case
When we think of a business we focus on its product, marketing operations, sales and support data to provide valuable business information. Success in blending such data is crucial in creating smart insights and uncovering useful trends.
That is the reason many companies build a data warehouse and consolidate information from all these business functions. That is a demanding process though: it requires the involvement of the core development team, diverting them from the development of your product, and resulting in substantial time loss and increased costs.
Our partner Blendo, allows you to connect a variety of data sources from marketing, ads, customer support or CRM e.g. Zendesk, Stripe, Intercom or Mailchimp into your data warehouse. Blendo provides output to multiple data warehouses like Amazon Redshift, Google BigQuery, Microsoft SQL Server and PostgreSQL. And, it only takes a few minutes to get from zero to ‘up and running’ with your integrations and start loading your data into a single place.
For a complete list of the integrations, view Blendo’s Integrations page.
Getting all the raw information together will provide your organization with the ability to have a clear view of your data at any moment in time. Having all this information in one place, will allow you to use Chartio in order to connect the dots and generate actionable insights for your entire business.
The following examples will demonstrate how to use Blendo to connect and collect your data from multiple sources and visualize it using Chartio.
Churn And Ticket Resolution Time
How does customer support affect your churn rate? Does it have a negative or a positive impact? Handling customer support tickets is a very critical dimension in a company’s strategy. In many cases it can even be a sales creation tool. However, it can also prove a liability, so having a way to assess its impact can be extremely useful.
One way to measure this, would be to relate churn with ticket resolution time.
Blendo will assist you to get your Zendesk support data, along with Stripe payment data, and push everything consistently into your data warehouse. With Chartio you can then easily visualize the time your representatives spent and relate it to your churn rate.
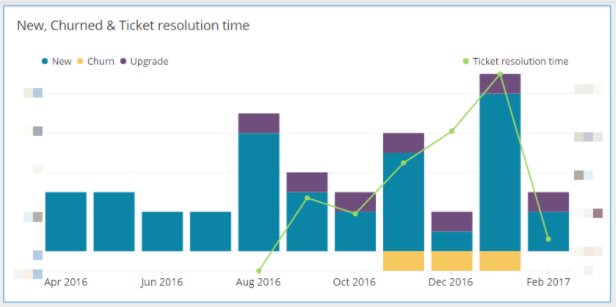
Churn and Ticket Resoluiton time chart in Chartio.
Attribution
An eCommerce company may acquire customers from various different channels. How can
you understand which of these channels prove more fruitful in getting a customer in your Shopify shop?
Ads running in Facebook Ads or Google AdWords for example can potentially drive the same users to your Shopify store. How can you assess which one is actually more efficient?
Getting data from your Shopify sales along with your Facebook Ads or Google Ads spent in one place with the use of Blendo, will allow you to connect the three seemingly independent sources of data. Next, with the help of Chartio, you can better visualize your data and eventually decide which channel you should concentrate on.
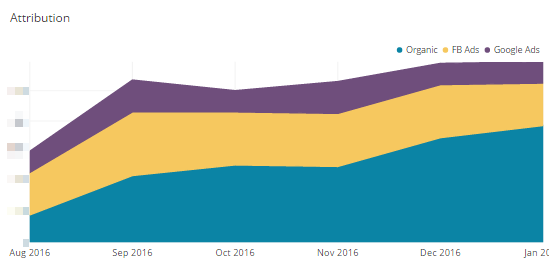
Ad Channel Attribution chart in Chartio.
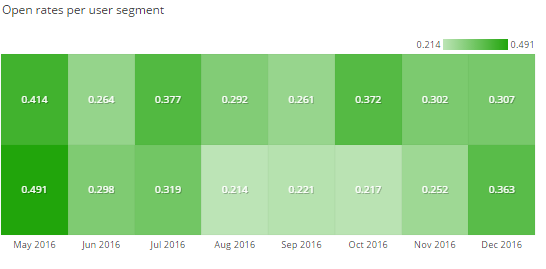
Marketing
A typical email marketing tool pattern is viewing your reports according to your campaigns. But what if you have a lead nurturing campaign running under a tool like MailChimp or Mandrill and want to get insights based on advanced segments of users?
Blendo will collect all your email marketing data into your data warehouse. That will help you capture individual tracking posts, not only aggregated data (i.e. for Mandrill, you could get every single tracking event into a table). Having all your raw data in one place means you can run your reports based on segments of your customers. And with Chartio’s help, it is easy to visualize all that information, just like in the following chart.
Ready to unlock your data?
We’re excited with this partnership, since the powerful capabilities of Chartio and Blendo complement each other so well. Connecting your disparate data sources and having a data infrastructure up and running in minutes, will supercharge your data warehouse consistently with valuable data. Accessing that data warehouse with Chartio will assist you to connect the dots, get smart business insights and make data-driven business decisions.


