Chartio Is Narrowing the Data Literacy Gap in Business
Posted by on September 19, 2019 Data, Business Intelligence, Chartio, Data Governance
(This article is written by Allen Hillery. Allen is an adjunct professor at Columbia University and a writer at Data Visualization Society. The original post can be found here.)

Matt David is Editor of the Data School at Chartio. He believes data has become a part of more and more non-data jobs and he is passionate about making data concepts more easily understood. Illustration by Veronika Hammond.
In my last article, we had the opportunity to hear from Looker’s Chief Product Officer, Nick Caldwell, to get his thoughts on the acquisitions of Tableau and Looker as well as where he sees business intelligence trending. He summed it up in part by saying, “People aren’t going to go to BI, BI has to go to the people. This is already happening in a big way.” Nick believes that the future of BI will lie in SaaS apps that will be in the hands of not just analysts but mainly nontechnical business users. Already, the proliferation of Saas apps is putting the power of BI in more hands and narrowing the data gap.
Matt David, the product lead at Chartio’s Data School, predicts a similar future for BI and has taken an active role in shaping it. Data School is a community-driven school of free web books and content written by people who work with data for people who work with data. I also had the pleasure to contribute content to their library of web books! While working together, we discussed business intelligence trends and how the Data School fits in to the larger picture.
Matt joined Chartio about five months ago to relaunch the Data School and plans for it to be a trusted and valuable resource for content on data. The Data School teaches organizations to leverage their data more effectively. Matt hopes to address data literacy, best practices in data, and data stories from professionals. This includes helping employees:
- Identify missteps they are taking in their analysis and what to do about it
- Increase the adoption of SQL through visual learning
- Create data warehouses that are easy to use
Getting the data right
Matt believes companies need to focus on the fundamentals of “getting the data right.” He pointed out how AI, machine learning, and data science are dominating headlines but are a distraction for most companies whose data is not clean and difficult to analyze.
Most companies are still struggling with accurate analysis. Predictive methods only works if it is based on clean data and sound analysis so. Companies need to spend more time on the fundamentals.
Matt knows the benefit of getting the data right from personal experience. He used Chartio at his previous company and gave feedback about what he perceived to be the product’s slow query speeds. Chartio’s CEO, Dave Fowler, reached out personally to understand Matt’s frustrations. Matt agreed to meet and Dave listened patiently and calmly to his pain points.
The world has gotten really good at collecting data, now the largest bottleneck is our ability to understand the data and make informed decisions based on it. — Chartio’s view of the BI landscape
Dave helped Matt to understand the underlying problem. He explained how the lack of data modeling and current data governance practices were not optimal and were causing slow query speeds. He then explained exactly what Matt’s company needed to do with data engineering and governance to solve the speed problem. Matt respected how the CEO handled the situation and informed him about what part of the data stack was actually causing the problem.
JOIN people ON data
Chartio’s mission is simple — they aim to “enable anyone (not just data teams) to be able to explore, analyze and understand data.” When Chartio saw the need to continue to teach companies best practices in data and was looking to hire someone to run their education effort, Matt jumped at the opportunity. He’d seen students struggle to learn a variety of business intelligence tools and wanted to work for a company building a data tool that was focused on intuitive interfaces to data.
Chartio has a two-pronged approach to JOINing people ON data:
1. Build a powerful, flexible product for working with data that’s simple for anyone to use
Matt explained that a lot of BI companies approach the problem of making their tools easier for business users by limiting what data they have access to and by putting it in simplified flat table formats. He goes on to say that while this sandbox approach prevents business users from making some mistakes in their analysis, it also limits what type of questions they can ask, prevents them from developing more data skills, and stops them from being able to follow their curiosity.
Matt points out that Chartio has not shied away from providing full schema access to users and making it intuitive to query complex schemas with their visual SQL product. Visual SQL is Chartio’s unique interface to SQL, which enables both data analysts and business users to analyze data from almost any source through a single, intuitive, flexible, drag-and-drop experience. This is Chartio’s answer to helping companies “get the data right”: empowering all users to query their databases in the most common DB language without necessarily knowing how to code. Users can begin to explore, analyze and become familiar with their company’s data through a visual language or “interactive mode” as it’s described on the platform.
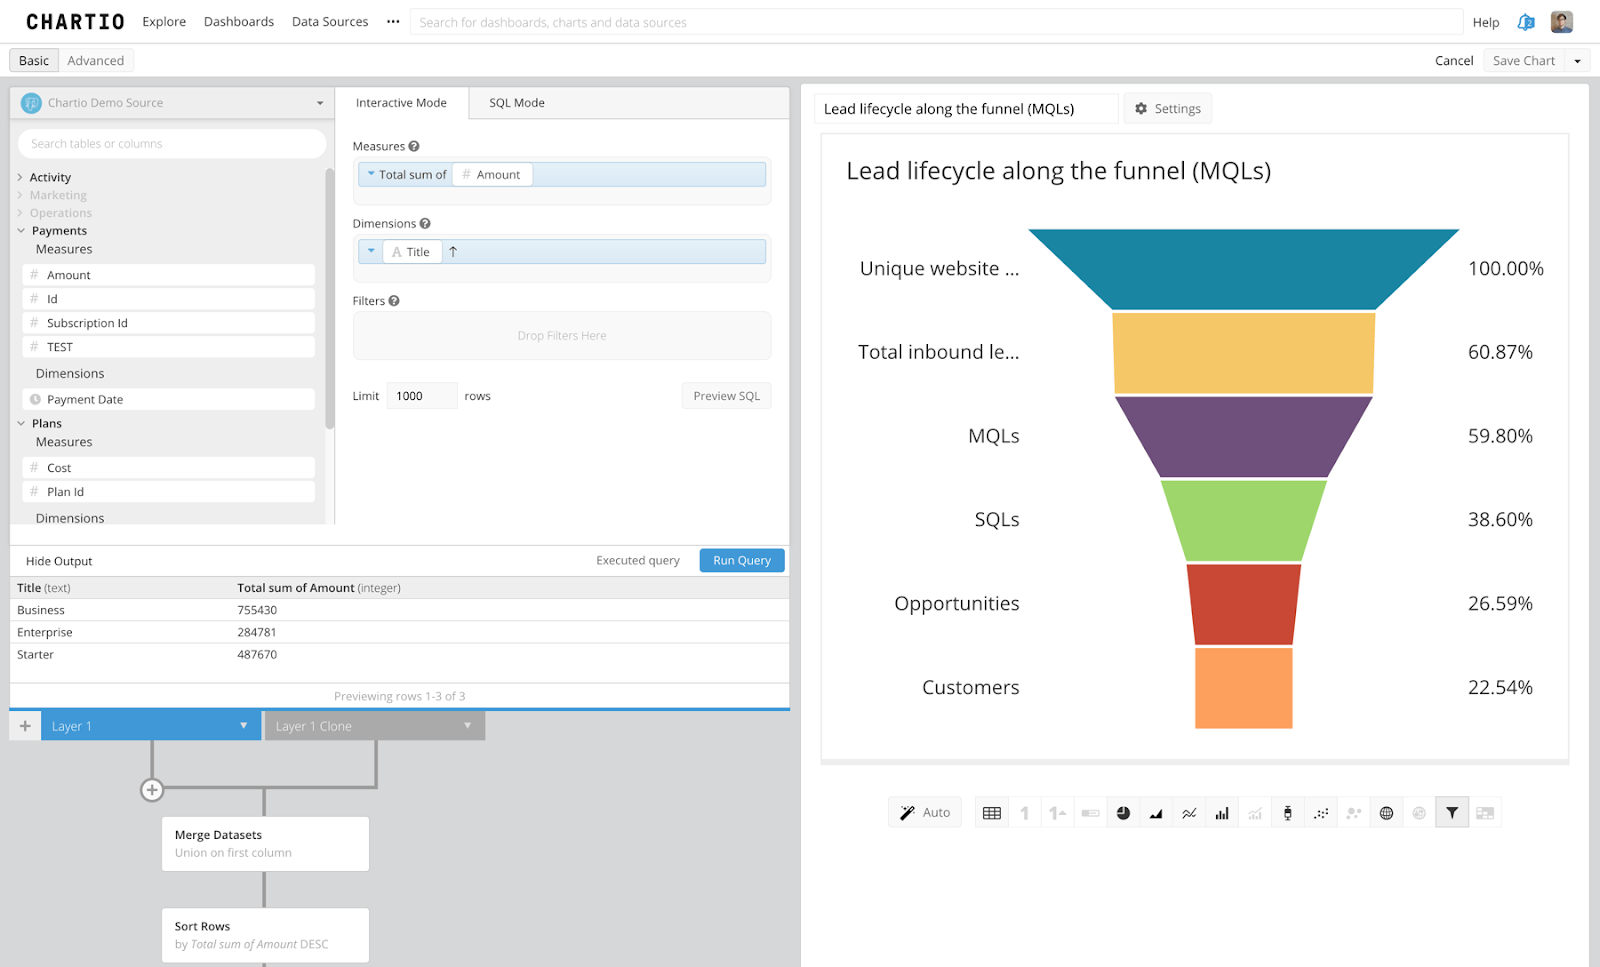
Chartio’s Visual SQL empowers users to explore, analyze, and become familiar with their company’s data by providing a user interface that allows them to query the database through an interactive mode. The option is also there for those want to use SQL to switch tabs to that mode. Screenshot from Chartio.
As I was browsing Chartio’s site, I came across the Visual SQL page and started reading “The Power of Visual SQL” section. Will placing the power of BI in the hands of nontechnical users begin to narrow the data literacy gap? Chartio listed out a lot of the benefits Nick Caldwell and I discussed like data teams having more time to work on more complex analysis and empowering their business users to analyze their own data. I smirked at the business team benefit of “getting insights in minutes, not weeks,” as I recall many meetings where our leadership voiced their frustration with the backlog of assignments in queue. What really caught my attention was “No need to learn SQL or any other proprietary language to explore your data.” As an analyst, I pride myself on being able to query databases and mining through data to glean insights. Now it seems that there are tools taking the fun away. I asked Matt his thoughts and he commented that Visual SQL makes it much quicker to start seeing data. If analysts prefer, they can still use SQL on Chartio.
2. Promote data literacy via prolific, relevant and useful education
It’s been said that “with great power comes great responsibility.” Chartio is taking the responsibility for putting their Visual SQL tool in the hands of many by running the Data School. Matt is having a blast building this online community and engaging content creators. In his own words, “I am helping [to] build another platform for people to create and share best practices in data.” With seven free books currently available, Matt plans to have another four free books written, with the help of the community, on the site in the next three to four months. The books speak to the core of Chartio’s mission of getting the data right ranging in topics from Misrepresenting Data, Teach People SQL, Data Governance, and Learn SQL.
I had a chance to read How to Teach People SQL, and really enjoyed the visual approach it takes in teaching people SQL joins and other elements of the syntax. Matt admitted that this book was near and dear to his heart. “We spent a lot of time creating gifs to make understanding SQL more intuitive and have gotten a ton of great feedback about how this has helped people,’’ Matt said proudly. The great thing about these books is that they are built by a community of people who are passionate about data. He describes the community as being extremely supportive and generous with their time and knowledge. Matt plans to grow this community of readers and contributors over the next few months.

SQL inner join visually explained from the web book “How to Teach People SQL” Matt and his team of contributors worked on this visual presentation of SQL joins in addition to creating gifs to make it more intuitive to the user. Illustration by Chartio.
Five ways BI tools are empowering users and narrowing the data literacy gap.
As data sources continue to grow across organizations, more tools will need to be developed to address nontechnical members of the workforce. With the influx of data, we’re going to have to put the power of data mining in more hands. One can even argue that a businessperson given the right tools can mine for insights more effectively than a data expert given their knowledge of the business.
People ultimately want insights that help their business. The dominant trend will be the one that delivers the most value.
A marketing person who might have less technical expertise will be able to interpret nuances or trends in the data due to knowledge of their business or industry. With this paradigm shift in the data landscape, companies are going to need to invest in narrowing the data literacy gap in their organizations. Regarding BI tools, Matt and I discussed five trends he’s seeing that empowers the workforce and begins to narrow the data literacy gap.
dbt, looker, and mode made Matt’s list of tools that are upskilling analysts to the level of engineer. Illustrations by Veronika Hammond
1. Tools are empowering analysts to be more like engineers
The first trend that Matt pointed out is how BI tools are giving analysts more autonomy when it comes to the data workflow. One thing I can attest to as an analyst is having to download my data set from the data warehouse which effectively makes my data stale. This was the best course of action as connecting directly to the database either bogged down my dashboard’s performance or called for several meetings to get access to a database table.
There are tools popping up that give analysts more control and flexibility with connecting to data sources and manipulating data sets. Tools like dbt advertise that analysts can take ownership of the entire analytics engineering workflow, from writing data transformation code to deployment and documentation. Mode cautions that your business isn’t “drag and drop simple” and that self-serve dashboards are “limited.” Matt agrees that more analysts will have an interest in learning code but there is an upper limit on this. He believes that the goal for the business is insights, not improving people’s technical skill. He further made a point that I can attest to about companies needing to embrace coding norms in multiple parts of their business. In other words, there needs to be a level of governance for consistency and one source of the “truth” when it comes to reporting on data.
So long as these efforts lead to more insights great, if it’s extra effort for that not much more value than this might not stick.

Matt believes tools like Amplitude, Heap and Hubspot are following the growing trend of BI tools making it easier to derive key insights. Illustrations by Veronika Hammond.
2. Putting analytics in the hands of non-analysts
The more I discuss data literacy, the more clear it is that there are two sides of this equation. On one side, more data-literate members of the workforce are able to take their skills up a notch, to potentially rival engineers. The other side shows a workforce where less technical members have access to analytical interfaces that don’t require coding. “Getting very specific about the types of data and analysis you are doing makes it easy to templatize and produce insights for people with minimal effort,” Matt explained. Tools like Amplitude and Heap are doing this already and Matt believes this will continue to be a huge growth area in BI.
There have been a lot of data literacy efforts being made across organizations, which have the potential to empower all levels of the workforce, especially less technical employees. Equipping a marketing or sales person with the technical expertise to pull routine requests like weekly performance or a prescriptive analysis is an easy win and frees the data team to work on more complicated predictive analysis. Furthermore, a more technical employee who is focused on honing their data skills may not have as much bandwidth or motivation to learn the business and its data nuances. I asked Matt if he agrees there are great benefits in putting analytical tools in the hands of a businessperson who is armed with knowledge of the business and a burgeoning reporting guru. He agreed that these combined qualities make it easier for an employee to find insights.
The tools/data/insights are coming to the user in their department. Since these tools are designed around the type of data they need to analyze they can deliver great experiences quickly.

Chartio, Sigma, and Data Studio is promising powerful analytics made simple with no SQL required. Illustrations by Veronika Hammond.
3. Make working with cloud databases as easy as or easier than working in MS Excel
One trend that Matt is excited about is “No SQL Required.” As we mentioned earlier in our discussion, Chartio promises “powerful analytics made simple.” This again can be useful for marketing and sales personnel looking to review historical trends to estimate how much product to allocate for the back-to-school season or who to target with what geographically. Most of today’s tools have the capability to leverage visual interfaces while running complex SQL queries that would take an analyst a good day or two to code. Another tool, Sigma, describes an environment where you “explore data without limits.” Again without the learning curve or restrictions of coding, a finance person can begin to do sales forecasting without cracking open a SQL textbook.
The common theme across both tools is that you can be up and running in minutes and use simple intuitive commands to work with large amounts of data in the cloud. Matt views this as the most practical trend as every company is getting more data so finding ways to leverage it in traditional ways is the biggest market opportunity. In addition, having the capability to explore the data however you want offers the greatest flexibility. Matt speculates it will likely lose out on some market share to industry-specific tools but will continue to grow as MS Excel users need to be able to manipulate any large arbitrary data set.
This is the holy grail but is the most challenging to execute on, making all your company’s data simple to work with. I am excited to be a part of this trend and hope we can deliver with Chartio.

The influx of data is causing organizations to step up their data governance efforts. AirBnB and Lyft have both built data portals to address this challenge. Illustrations by Veronika Hammond.
4. Make data within an organization searchable
One of the challenges organizations face is managing their data sources. Without data governance, various lines of business can end up using multiple data sources and having different versions of the truth with reporting. When I was tasked with building a data governance charter, I experienced this firsthand. One step we had to take was to use metadata so analytics teams didn’t repeat analyses and could find good data sources.
Matt and I chatted about how companies are making data within their organizations searchable with the goal of saving time and increasing the accuracy of reporting. One company that came up was Lyft. They recently developed a data discovery application code named Amundsen. Named after the Norwegian explorer Roald Amundsen, the application sits on top of a metadata engine and provides a search interface for data discovery. I can’t stress how helpful a metadata tool can be; they can save hours when searching for a specific data table.
Another brand who is making strides with their employees’ data literacy is AirBnB. With the influx of customer information, they’ve made investments in building a data portal to provide tools to make better informed decisions. This, however, created another challenge. Although they built robust data tools, there was a low adoption rate. AirBnB spent roughly two years developing a Data University to empower their workforce to make data-informed decisions. One of the amazing results recently reported was a 50% increase in active use of their internal data platforms.
This is a new trend that feels like it should already exist. I expect this to be rolled into more complete BI solutions.

Metabase and Superset are starting a new wave of open-source BI tools. Illustrations by Veronika Hammond.
5. Make BI more open source
The last trend that Matt observed was free, community-driven tools like Metabase and Superset. These tools lower the barrier to entry to using powerful BI tools. However, he acknowledges it can be difficult to maintain given the idiosyncrasies of varied data sources/tools and security requirements. Traditional BI tools typically provide some level of customer service to help with the inevitable data issues that occur. Open-source tools do not provide this, so you either need more highly technical people on your team to understand and fix issues or find third-party consultants. Metabase is the easy, open-source way for everyone in your company to ask questions and learn from data while Superset is a data exploration platform designed to be visual, intuitive, and interactive.
This could dramatically decrease the cost of working with data which would provide more people with access to data.
Where are these trends taking us?
I had a great time talking with Matt about the changes on the horizon for the business intelligence landscape. As for the Tableau and Looker acquisitions, Matt sees this as an opportunity for other tools to take center stage. He’s looking forward to the impact Chartio and the Data School will have on companies. Like AirBnB discovered, solving for the new BI Frontier will involve a tool with an intuitive interface to mine the data as well as a program that helps the workforce improve their skill and get better acquainted with their company’s information. The benefits of a data literacy program centered around the company’s data is motivation to learn for starters. A relevant data set is a key to success with the program. I believe companies in general will have early wins adopting tools that put analytics in the hands of the non analysts combined with a robust data literacy program.
Big shout out to Veronika Hammond for cranking this article up a notch with her awesome illustrations! Make sure to check out more of her work here!


