We Need New Data Books - So We Started One
Posted by on October 31, 2019 Chartio, Data Governance
In my work at Chartio, I get to meet many people who work with data every day. One of my favorite questions to ask them is, “Where did you learn everything you know about data?”
Surprisingly, most people tell me they’re completely self-taught and have “just figured it out”. As a follow-up, I ask what sources they’ve relied on, and the answers are all over the map. Mostly they’ll cite Google, StackOverflow, blogs, and sometimes these books:
- Agile Data Warehouse Design by Lawrence Corr (2011)
- The Data Warehouse Toolkit by Ralph Kimball (originally published in 2004 with a 3rd edition update in 2013)
These books were very good for their time, and became classics. But in the timeframe of data, they’re ancient. Both were written before Redshift and the gains of the cloud C-Store warehouse. Back then, data was at a totally different scale, had very different costs, was used with totally different products, and was handled by people with very different training—primarily just at enterprise companies.
It has gotten to the point where pointing people to these books can do more harm than good.
New best practices and a new book
Over the years, my team and I have had the incredible opportunity to work with many data teams, architectures, tools, and platforms, and we’ve built up a body of knowledge around what works—and what doesn’t—when it comes to data. We’ve been sharing this knowledge with customers, and waiting for someone to publish a book on these maturing modern data best practices. We got a bit impatient and earlier this year, we gathered our notes and combined knowledge and started the new data book ourselves:
We call it Cloud Data Management (4 Stages for Informed Companies), and today we’ve launched it as an open, free book on our community education site DataSchool.com.
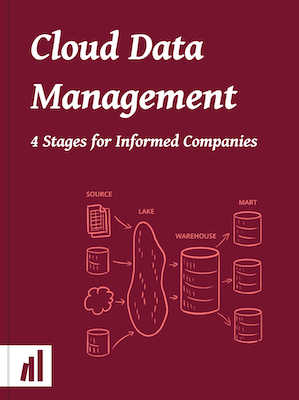
The following is an overview of the book and an introduction to its central framework: we’ve found that there are 4 main stages of sophistication that companies go through with their data, and these stages are very much tied to what the data stack looks like at each stage.
We call the stages Source, Lake, Warehouse and Mart.

Each vertical stage in the above diagram is a valid stack to operate from, depending on your resources, size, and the importance of data within your organization. For example, a 20-person team with typical data needs will likely be fine working directly at the source level, and won’t want to move to the Lake stage until they start feeling the growth pains. But as that company grows past 200 people or so and their data needs expand, it will be incredibly valuable—and perhaps pivotal—to advance all the way through to the Mart stage.
Let’s dive into a deeper explanation of each stage:
Stage 1. Sources

When you start working with data, you may only have a few sources of interest. Two common early sources are Google Analytics and your application data in whatever PostgreSQL or MySQL database your product uses. If only a few people at your company need to work with these sources, you might set them up with direct access; it’s more simple and agile for them to just work with the data directly.
At this early stage, you’ll benefit from using a BI product that lets you write SQL when needed, as your data is likely structured for transactional purposes and will often need the full power of some hairy queries.
Stage 2. Lake
As you start to rely on more data sources, and more frequently need to combine your data, you’ll want to build out a Data Lake—a spot for all of your data to exist together in a unified format.

Especially when you need to work with data from applications like Salesforce, HubSpot, Jira, and Zendesk, you’ll want to create a single home for this data so you can access all of it together and with a single SQL syntax, rather than many different APIs.
If this is an enormous amount of data (> 100GB per day), you’ll want to store this in S3. But for most use cases, you’ll want to store this in a Data Warehouse engine like Redshift, Panoply, Snowflake or Big Query.
Here, your data is still in its original transactional or event structure, and will require some messy SQL at times—which will still limit who can realistically work with the data. The Data Lake will, however, be more performant, available in one spot with one SQL syntax, and will set you up well for the next important stage.
Stage 3. Warehouse (single source of truth)
In the Lake stage, as you bring in more people to work with the data, you have to explain to them the oddities of each schema, what data is where, and what special criteria you need to filter by in each of the tables to get the proper results. This becomes a lot of work, and will leave you frequently fighting integrity issues. Eventually, you’ll want to start cleaning your data into a single, clean source of truth.

This stage—creating a data Warehouse—has historically been quite a nightmare, and there are many books written on how best to model your data for analytical processing. But these days it’s not as hard—and will not only spare you from having to explain all of your schemas’ oddities to new team members, but will also save you as an individual time in having to repeat, edit and maintain your own messy queries.
We’re working on a whole other book on how to properly model data, but the high level facts are these:
-
Do your modeling as new schemas of views in SQL—either with your own files, or using a great framework like dbt.
Don’t use a proprietary third party modeling language; this is all best done in SQL. It’s powerful, performant, vendor agnostic, and your team already knows it.
-
Don’t overthink your modeling by reading too many books on dimensional modeling by legends like Inman or Kimball. The majority of the books out there are decades old, and as I described above, the best practices then were based on completely different technology considerations.
Your analytical models now should just be simplified, filtered, minimal, descriptively-named, clean versions of the original transactional schemas. Create them as if your company didn’t run on many disparate detailed SaaS applications and transactional databases with odd edge cases and complex integrations. Instead, it runs on a single, ideal, perfectly-cleaned, monolithic application. This ideal application has a clean operational schema that will slowly evolve as it serves as the source of truth for your company.
Stage 4. Marts
When you have clean data and a good BI product on top of it, you should start noticing that many people within your company are able to answer their own questions, and more and more people are getting involved. This is great news: your company is getting increasingly informed, and the business and productivity results should be showing. You’re also less worried about integrity issues because you’ve modeled the data, and you’re continually maintaining it to be a clean, clear source of truth.
Eventually, however, you’ll have hundreds of tables in that source of truth, and users will become overwhelmed when trying to find the data that’s relevant to them. You may also discover that, depending on the team, department, or use case, different people want to use the same data structured in different ways. For these reasons, you’ll want to start rolling out Data Marts.

Data Marts are smaller, more specific sources of truth for a team or topic of investigation. For example, the Sales team may only need 12 or so tables from the main Warehouse, while the Marketing team may need 20 tables—some of them the same, but some different.
The method for creating these Data Marts is the same as for the Warehouse. Simply create new schemas using SQL of views pointing (materialized or not) to the source of truth.
The importance of a great data stack
Choosing the right data solution for your company is critical because, simply put, companies that are better informed win.
To emphasize this point, imagine the marketing teams of two competing companies:
- An informed team that knows which channels work and which don’t.
- A relatively blind team that knows their spend but can’t track attribution effectively.
The informed team will be able to continually experiment and quickly double down on what works, while stopping spend on what doesn’t. In a short period of time they’ll be dramatically more efficient and effective with their resources, and will leave the blind team in the dust.
This doesn’t just apply to marketing. Using the “informed team vs. blind team” framework, you can see that being more informed than your competition is a dramatic advantage for any team in business.
Book launch and how to contribute
The above framework serves as the basis for our new data book, which we’re launching today! Like all of the content on Data School, it’s meant to be an open book, with contributions from the community. The book currently has direct input from a number of people, and is influenced by hundreds more.
It’s also hosted on github, and we welcome pull requests and comments. We also take submissions to improve the book through Google docs and emails.
We’ve already got a great community start with a chapter from each of our Chartio Data Advisors, one from Kostas Paradalis of Blendo and the rest written as a combined effort of myself and Matt David, the Head of the Data School.
We’d love to add more real company stories and examples, and continually add in more best practices. If you’re someone who’s worked through these stages, or are at one now and have experiences to share (positive or negative), we’d love any help in reviewing or contributing content. You can join us on our dataschool slack channel or write us at mdavid@dataschool.com.
And if you’re a company who needs help getting through these stages, we’d love to talk. We have a full staff of knowledgeable Data Advisors who have assisted hundreds of companies in getting set up to become informed and win.
Special thanks to Matt David, for creating this book with me, my Data Advisors for each contributing a chapter, Steven Lewis for the great illustrations, and Eleanor Preston for helping me work through this framework on so many customer visits - and persistently waiting for us to get it published!
Also thanks to Tristan Handy of DBT, Kostas Pardalis of Blendo, Yaniv Leven of Panoply, and Reynold Xin of Databricks for their help and review of this framework and article.
Dave Fowler
CEO @ Chartio


