Today we’ve released our new architecture and interface for exploring and analyzing data in Chartio. The new architecture will enable Chartio to continue releasing increasingly powerful features while at the same time improve its ease of use.
We are calling it the Data Pipeline because it breaks down the process of working with datasets into a pipeline of steps. Let me show you how it works.
The Steps
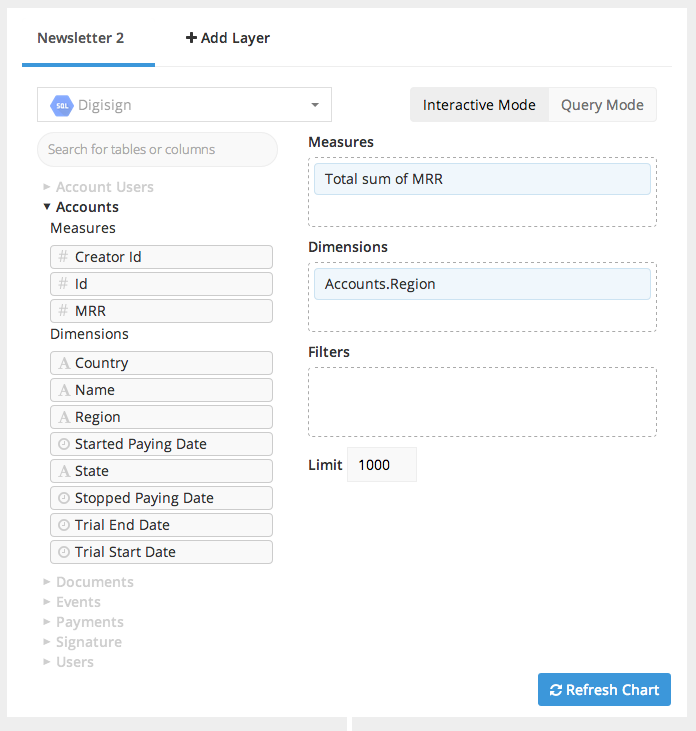
The first step in the pipeline is always selecting a set of data to work with. Apart from a few design improvements explained below, the drag and drop query building interface has not changed.
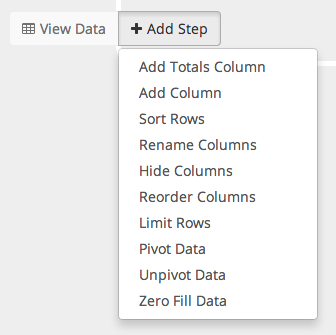
Once a starting dataset is selected additional steps can now be added to process the data. Currently the available steps include merging datasets, calculating new columns, rearranging, hiding, sorting, pivoting and more.
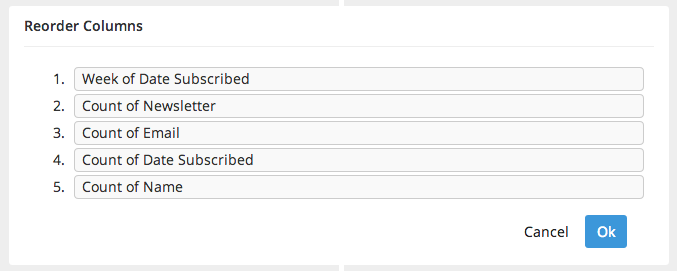
Each step is designed to be as simple and intuitive as possible. Each has its own white box on the pipeline and its own set of options to serve its purpose. The step to _reorder_the columns for example has the following drag to sort interface.
And the merge step simply has a single menu for choosing the type of merge to perform.

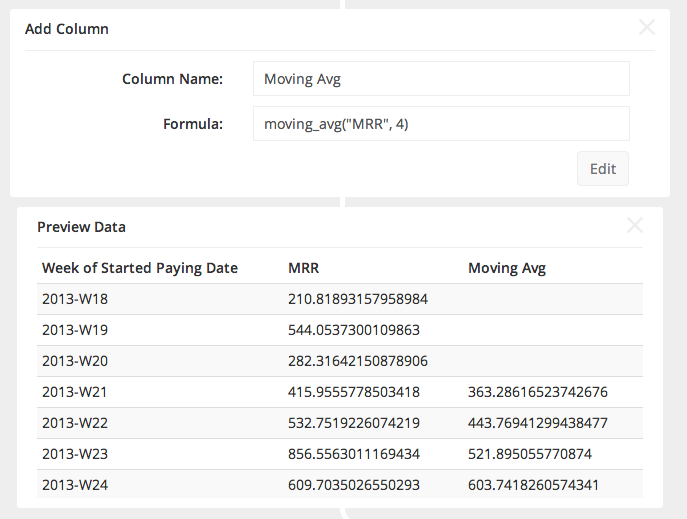
At each step in the pipeline you can choose to View Data, which will reveal a small table of a sampling of the output.
In the example here, we’ve added a new column that is the moving average of the MRR. Choosing View Data helps to verify that the output pipeline now has 3 columns.
Layout and Design
Those of you familiar with the previous Chart Creator should find the Pipeline interface quite familiar and notice some exciting upgrades. With the new architecture several new layout and design considerations were made, including the following:
1. Anchored Visualization
One of the first things we noticed when working with the pipeline was that it can get long, and required a lot of scrolling to see the effects of changes. While you only really need to look at and modify one component of the pipeline at a time, it is always valuable to see the end result.
So instead of having the end visualization at the bottom, as we did before, we’ve fixed its position to be displayed always in the right half of the screen.
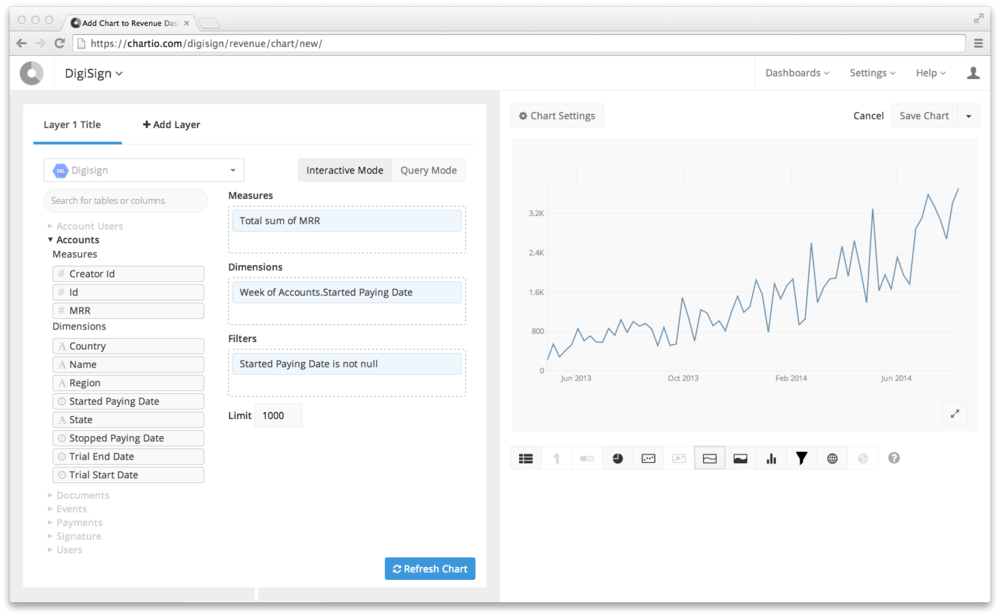
No matter where you are in the pipeline, the end table or chart will be available on the right.
2. Larger Data Bar
To make it easier to find the columns you need to build your queries we’ve doubled the size of the data bar. Before you could only see up to 8 columns listed at a time and now you can see 16 or more. Moving the visualizations to the right, and allowing the pipeline to be long enabled us to be less restricting to the data bar.
3. Icons for Column Types
Another improvement to the data bar is that all columns now come with an icon on their left side indicating what type of data the column contains. This makes it faster to scan for columns of a certain type and better indicates their contents.
![]()
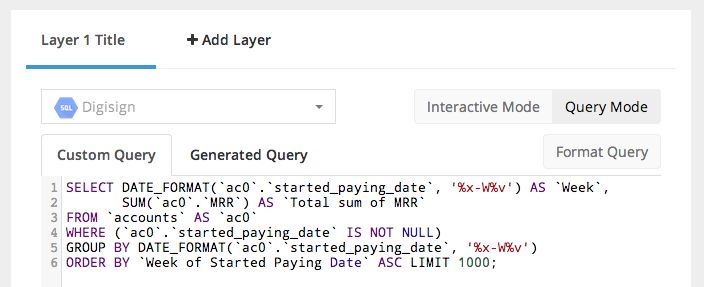
4. Full width Query Mode
From now on Query Mode will take up the full with of the data selector, hiding the data bar. This provides more visual room for larger queries, while removing the distraction of the data bar.
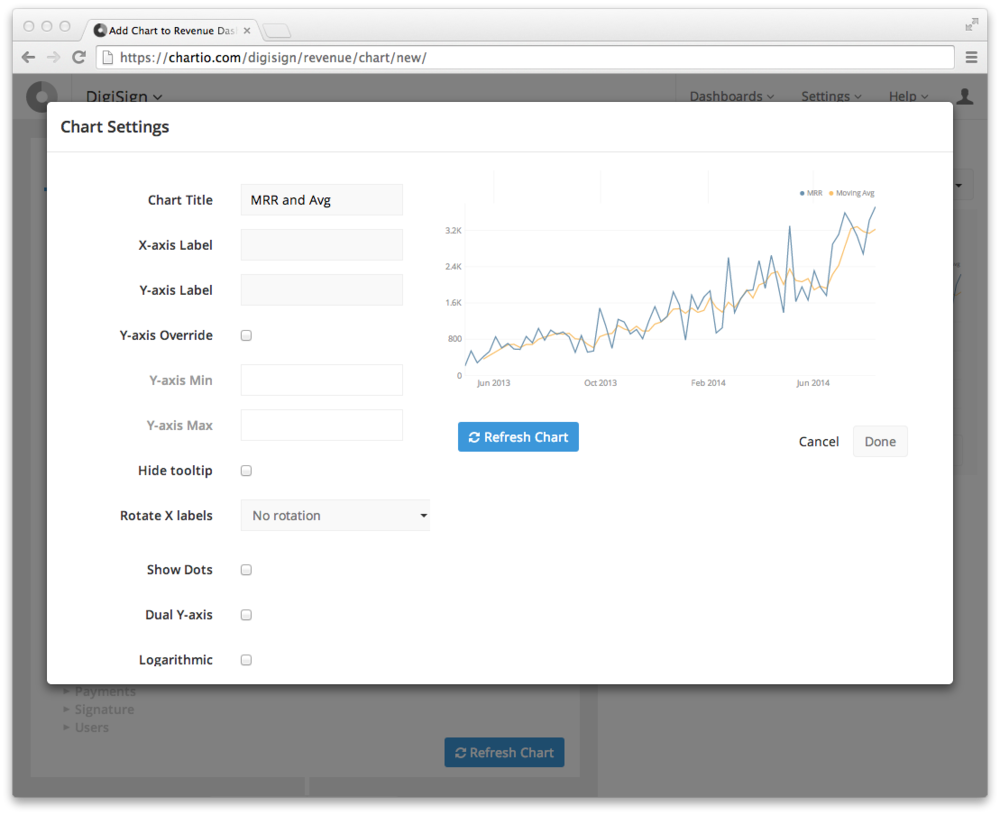
5. Expanded Chart Settings
We’ve been putting a lot of work into our charts, both through adding new maps, and more configurable settings. They’ve been getting too big and distracting to fit in the chart creating interface, so we’ve broken them out.
Next Steps
We built the Data Pipeline based on a lot of user feedback, usage data, and the need for a more extensible and flexible format for adding functionality. The steps available today are just the beginning, and you’ll be seeing more and more powerful features released, with little or no additional complication to the current functionality.
If you have feedback on the data pipeline, or requests for future steps that you would like to see, please send us a note at support@chartio.com.
