By popular request we added our first location chart types - maps and bubble maps! As we continue to improve our chart creator, we are dedicated to providing our users with the chart types they need to advance their analytical capabilities.
Map charts are useful for representing spatially related data. Most business data has a location, so variables such as revenue, number of customers, or population can often be displayed with a dimensional variable on the map. Visualizing data related to geographic locations is beneficial for detecting spatial relationships and patterns.
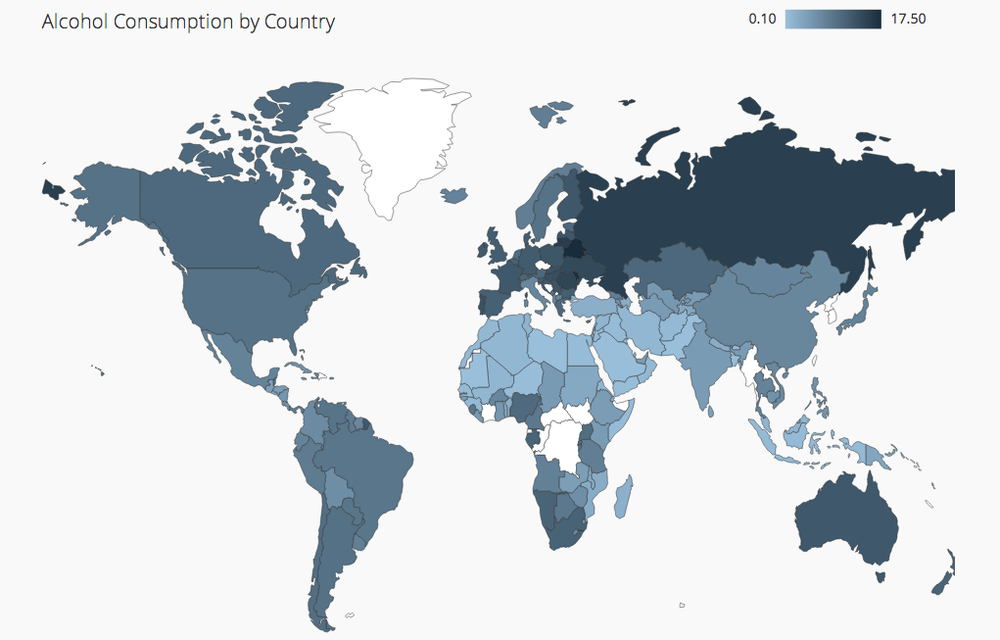
Chartio supports two types of maps: bucketed maps, and bubble maps. Bucketed maps highlight regions based on the magnitude of a measure, and currently support Country and US state buckets. To make a bucketed map in Chartio, select one column of location data as a dimension and select one column of values as a measure. Currently supported location types are country name, ISO alpha-2 country code, ISO alpha-3 country code, state name and two-letter state code. The generated map will create a range of color values between the largest and smallest measures, and apply the corresponding color to the selected dimension.
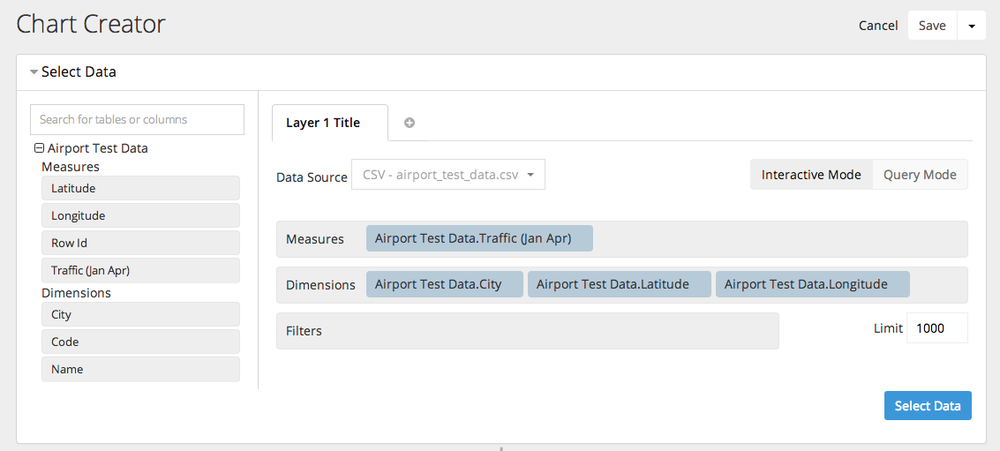
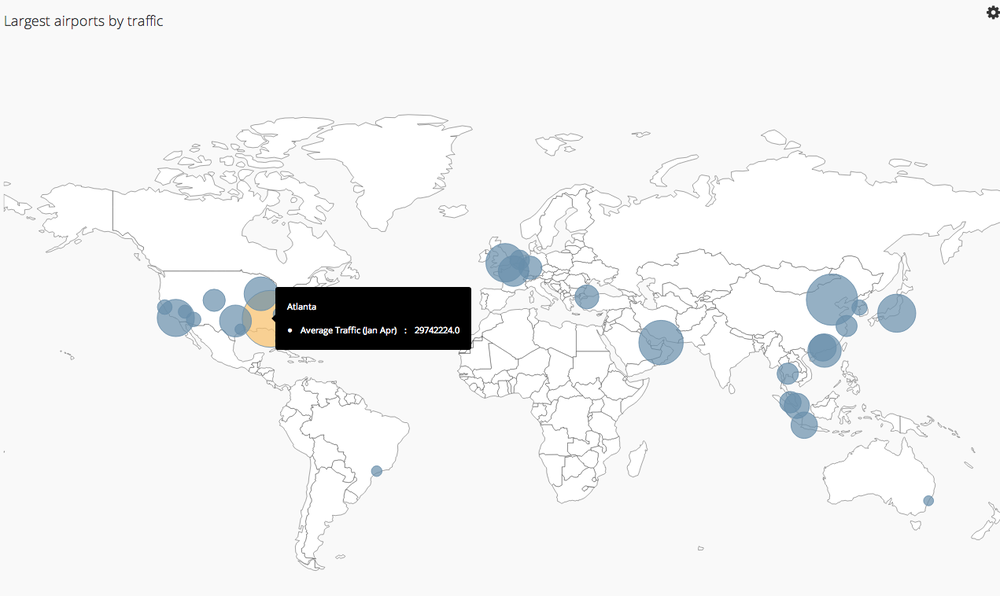
Bubble maps plot latitude and longitude points, and draw a circle with area proportional to the corresponding value. To draw a bubble map, select for three dimensional columns (in this order) - a label (such as the city name), the latitude and the longitude. Then, select one column of values as a measure for the bubble size. The bubble map chart allows you to view data for a more specific location, and size of the bubble will indicate the magnitude of the values.
With either chart type the map will be automatically generated with the locations you provided, but if you prefer you can select from map types of World, US, or Europe. We’ll add additional areas based on popularity, so be sure to let us know if you’d like an additional region added.
Be sure to check out the docs to learn more about creating map charts.
We hope you love the new map charts - let us know at support@chartio.com or on Twitter @chartio.


