Get More Value Out of Your Data with the Right Recipe
Posted by on June 28, 2017 Data, Data Analytics, Dashboards
[Editor’s Note: This is a guest blog post by Ben Gregory, the Product Manager at Astronomer. Astronomer is a data engineering platform that collects, processes and unifies your enterprise data, so you can get straight to analytics, data science and insights.]
When kicking off any new data initiative, it’s important to keep two thoughts front of mind:
1) Data (in whatever form, topic, or origin) was not created in a vacuum and should not be kept that way. Data only provides value when acted upon.
2) Any given dataset’s value is not constant throughout time. There is a window of relevance that data can inform but there is no going back if that data was not being observed or, worse, not being collected.
At Astronomer, we have never had a customer tell us that they want to start collecting data “just in case.” Sometimes they want a dashboard to have in their office, sometimes a daily report to send to their stakeholders and sometimes they want to build a product powered by the data itself. Whatever the case, there is always a specific use for that data in mind. While we can’t say waiting until you have a concrete need for your data is necessarily the BEST way to go about becoming data-driven, it does sense. Justifying budget spend is tricky enough even when there is a concrete project in hand.*
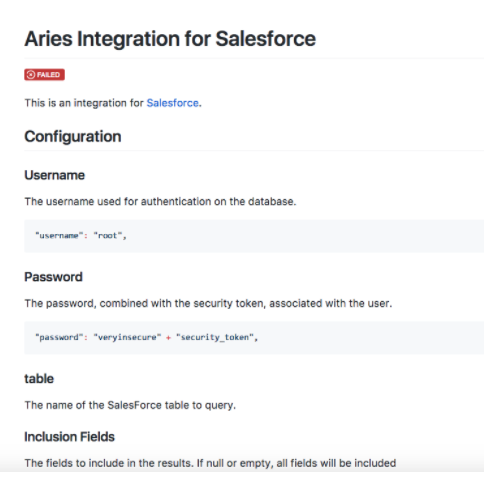
Typically though, when someone thinks, “I’d like a Salesforce dashboard,” they’re thinking about the questions they want to answer, not necessarily which metrics are needed to answer those questions or how to express them visually. They’re certainly not considering which endpoint in the Salesforce API they should use to make their request and how to optimally organize it in their warehouse. Going from the initial spark of wanting better insight into your Salesforce data to actually having a finished dashboard with insights requires a lot of intermediary steps.
*All of that being said, some data is generated once and lost if not collected (e.g. IoT, weather, clickstream) that can be often be valuable enough to justify kicking off a data collection initiative before a concrete project has been identified. Once lost, there’s no getting it back.
Astronomer Activities + Recipes
An underlying piece of technology we use at Astronomer is an open-source project originally created at Airbnb called Airflow. A key philosophy of Airflow is the “shift away from drag-and-drop ETL tools towards a more programmatic approach…ultimately code is the best abstraction there is for software.” Authoring data pipelines through code allows you to accomplish really any data pipeline you could dream of but the unintended consequence is that, if you’re just getting started on advancing your organization’s data maturity (such as wanting a KPI dashboard for data in one of your tools), it can be difficult to know where to begin. So to keep with this philosophy of powerful and expressive programmatic pipelines while also accommodating the rise of citizen integrators, who generally don’t have as much coding experience but know the end product they want, we’ve sped things up by creating templated Activities to perform various functions (e.g. extract data from a source, transform it in a certain manner, push it into a warehouse) to help our customers get their data moving faster. Activities are reusable and abstract away the boilerplate code (requesting building, authorization, and rate limiting) that can slow down data initiatives.
Activities certainly makes manipulating data easier by reducing complexity but still not quite as fast as we would like. Reading through that tool’s documentation, trying to determine (a) what is possible, (b) what is relevant to your business and (c) how the data should be organized can still leave a good about of upfront, non-engineering work to do when you really just want your project rolling. We’ve seen firsthand how difficult it can be to get started consolidating data from these tools, even when the processing infrastructure, pipeline scheduling and request building have been dramatically simplified. Ever tried getting ad performance data out of Google Analytics? It’s a minefield of incompatible dimensions, unavailable metrics and report request limits. Three weeks of trial and error later, you have 5 tables you think will be useful. Then you still need to send your request to an engineering queue to get your pipelines set up hopefully not too far in the future.
That’s where Recipes come in. Recipes are preconfigured pipelines that require the least amount of information upfront to give you the maximum amount of valuable data. That Google Analytics example from before? Here’s the Recipe, with step-by-step instructions, mappings and notes to make sure getting your data is easy and fast. The Recipe will also lay out what improvements have been made around the API itself, such as in the GA Recipe which skirts the 10 metric and 5 report limit on requests that Google enforces by making concurrent requests with different metrics and combining them after the fact.
Second Half of the Puzzle
But as we said in the beginning, it’s rare that someone wants data for its own sake. So when thinking about what is the next logical step to get our customers moving faster with data, the obvious answer was to work with the team at Chartio to pair some dashboard templates with our Recipes. Because Recipes are designed pull data into a database using a predictable structure and naming convention, not only can you get your data from Salesforce, Github and many other tools, but you can also have a preconfigured dashboard that will populate as soon as you hook it up to your Chartio account. With Astronomer + Chartio, you can go from zero data to a dashboard in minutes.
Let’s walk through one such recipe that we use at Astronomer: Github to Redshift.
Once configured with your Github username, password and API Key, the Github to Redshift Recipe creates 8 tables: Assignees, Commits, Commit Comments, Collaborators, Issues, Issue Comments, Pull Requests, Repositories. In our case, we’ve set the “repos” parameter equal to “allOrg” so that the Recipe knows to pull data not just for one repo but for all repos in a given Github organization. After that, it’s just a matter of hooking up our Github template in our Chartio account to the appropriate schema in Redshift.
We manage or contribute to over 270 repos between two organizations (github.com/astronomerio and github.com/aries-data), so it’s vital that we have a top-level view of the health and development of all repos in one view. If you have a particularly large or complex repo, you may choose to instead visualize only that one and customize the dashboard further to suit your needs. The great part of Recipes is that under the hood, they’re really just Astronomer pipelines so if you decide you don’t need a Collaborators table or don’t need certain fields in the Repositories table, it’s incredibly simple to modify our existing Recipe and make it your own.
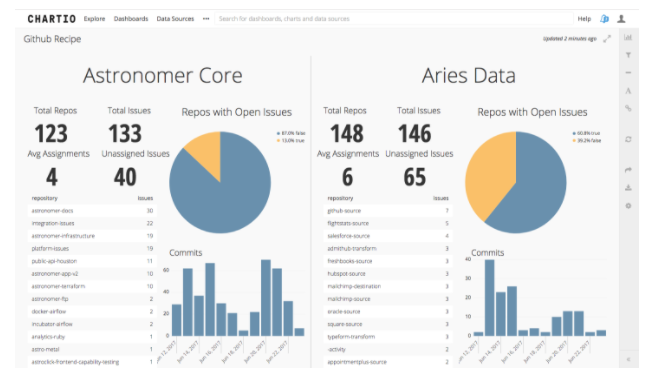
Because we’re creating a basic KPI dashboard to visualize our Github data, we want to make sure that a few metrics are given appropriate attention: issues, pull requests and commits. Our engineering team is organized into six-week releases composed of three two-week sprints, so we take advantage of Chartio’s dynamic time filter to make sure our charts are always reflective of only the last two weeks of progress.
For issues, we care about the total number of issues and where they’re located. More open issues and a higher percentage of repos with at least one open issue tell us how deep and widespread our technical debt is. Seeing one particular repo begin to accumulate issues without burning them down over time tells us where to focus. We can also see what the average issue assignment is and how many have gone unassigned to get an idea of how hard we’re pushing our engineering team and how much backlog we still have to burn down.
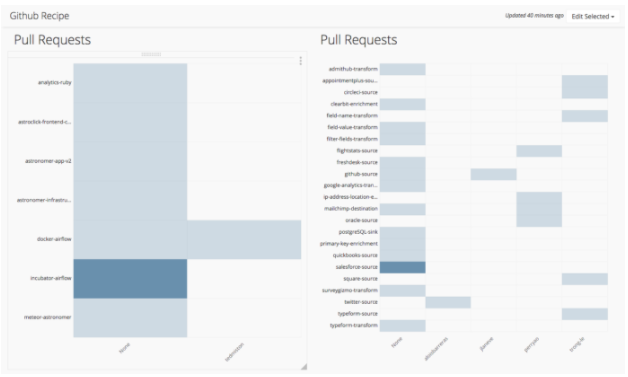
For pull requests, we want to know what outstanding Pull Requests have been assigned and which ones have not been assigned.
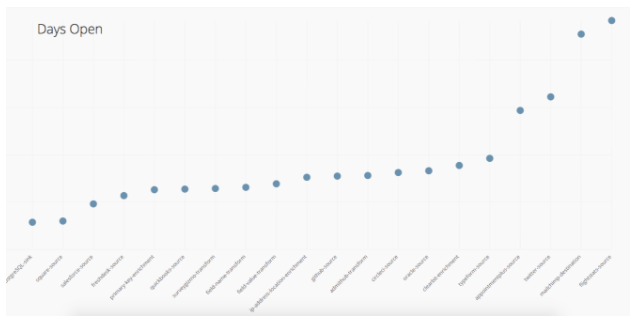
We also want to keep track of how long ago each of the open pull requests was made. The higher the dot here, the longer the pull request has been open. If it broaches a certain threshold we want to double check that it is still being actively worked on and hasn’t fallen through the cracks.
For commits, we care about the frequency and focus of development effort. By adding some annotations, we could enrich this view by noting when we made certain hires, brought on new customers and started new projects.
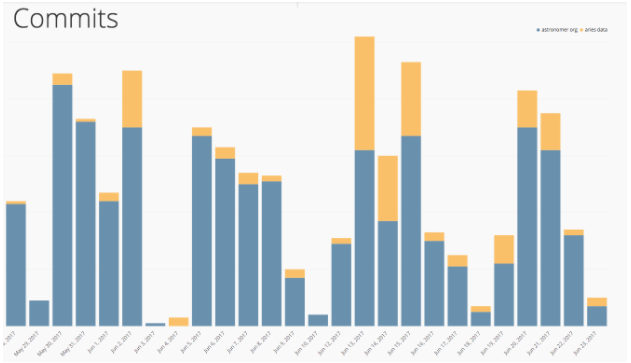
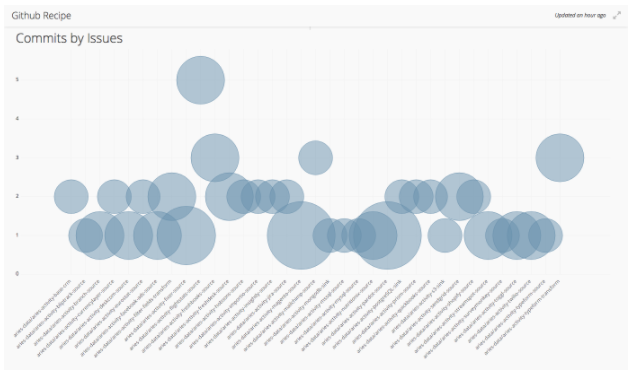
Generally, we want to make sure we’re committing our changes on a regular basis and that the appropriate repos (i.e. the ones with issues) get right amount of attention. In the below chart, we graph out the # of commits for the past two weeks against how many open issues there are.
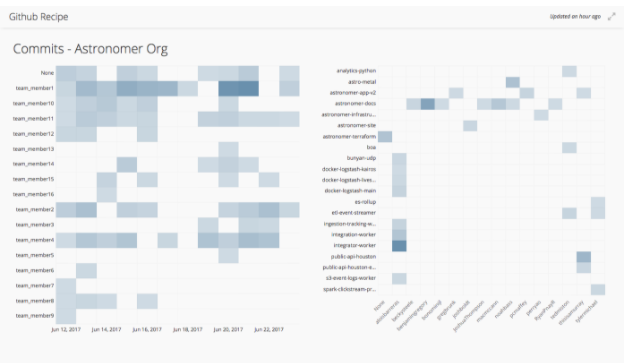
Again, some of Chartio’s great charting features, like annotations, can be progressively added to provide further context specific to a given organization’s operations. In the below chart, did team_member5 just decide to stop working for two weeks or did they go on vacation? Remember that data isn’t meant to be viewed in a vacuum. Context is critical.
These are just a few views possible to help you keep the momentum of your data initiative alive by getting up and running with a standard dashboard in minutes. Every one of these graphs can and should bring up further questions that cause you to delve deeper, but the great part about all of this is that you have the same flexibility and power of both the Chartio and Astronomer platform to ultimately decide what data is brought in, how it is organized and how it is presented.
Chartio and Astronomer take you 80% of the way there—the remaining 20% is the fun part. Once you have valuable, actionable data in an understandable way, your team can run further analyses, make decisions and, best of all, cook up creative new ways to increase revenue.


