Many customers who sign up for Chartio connect to their Google Analytics account. There are many things you can do with with your Google Analytics data in Chartio that you can’t do in Google Analytics itself. Such as writing custom formulas, blending your Google Analytics data with other data sources and visualizing alongside other data sources.
When you plug in your Google Analytics data into Chartio, a dashboard is automatically generated for easy viewing. Yet don’t stop there, add additional data to see the real magic of Chartio.
Custom Formulas
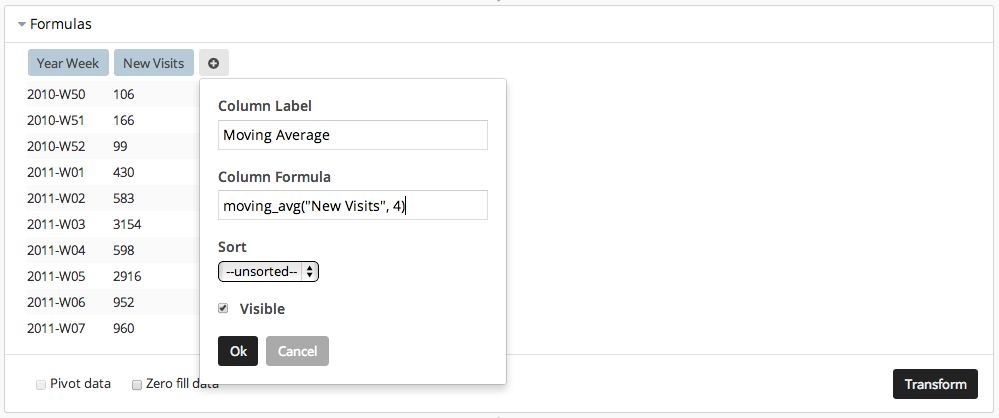
Google Analytics provides data on your site traffic but what if you want to perform calculations on that data? The Chartio Formulas section enables you to create new calculated columns based on the columns in the query result set. This feature is unique to Chartio, and thus allows you to make complex calculations on your analytics data.
For example, below a new column is generated with the formula that is the four week moving average of a visitors data set.
Chartio enables several different formula options, from our custom functions, SQLite functions, and other math functions.
Using Google Analytics with Other Data Sources
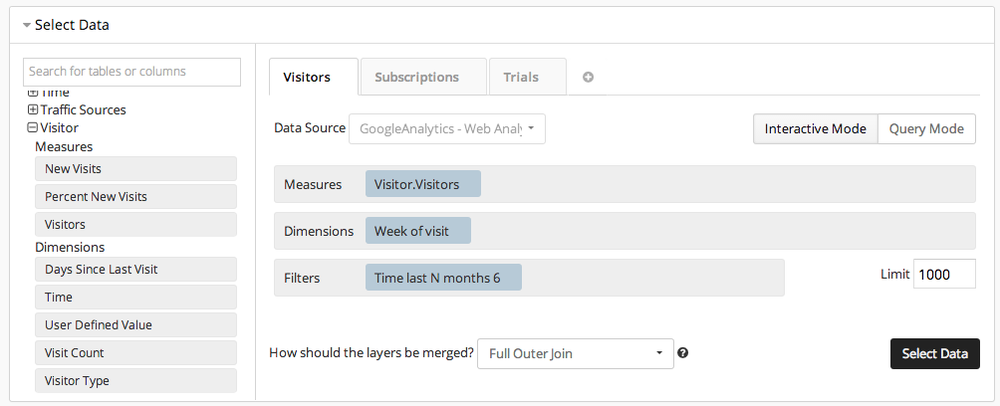
What if you want to compare data sources to your analytics, or perform calculations using multiple data sources? Data Blending with layers in Chartio allows you to make complex calculations using your Google Analytics data with other data sources and databases.
As an example, shown below is a Google Analytics query of visitors in a time bucket. This query is blended with subscriptions and trials data from a MySQL database.
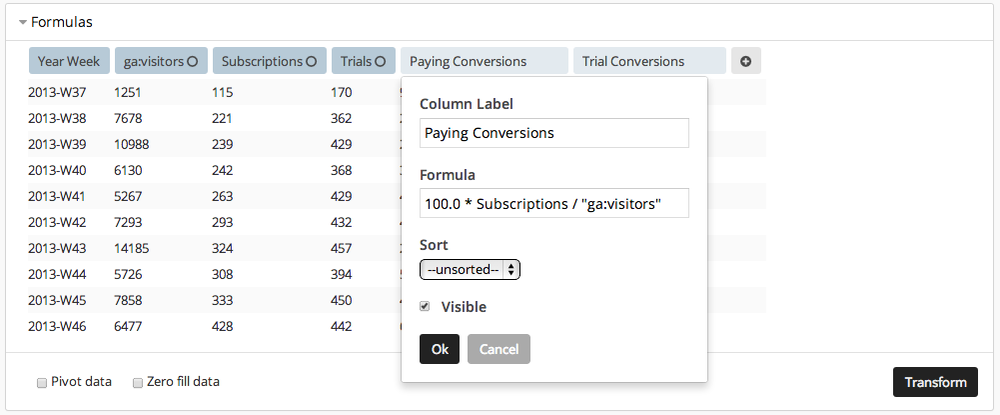
Inside of the Formulas section you can calculate conversion rate of the data subset by dividing the count of subscriptions by the number of Google Analytics visitors and multiplying it by 100 to get the percentage of paying conversions.
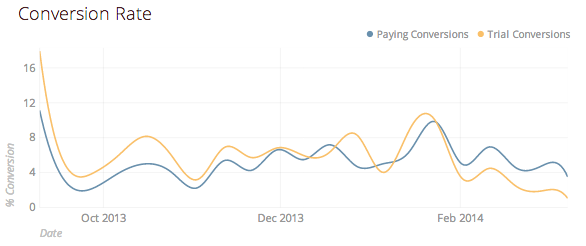
And the resulting chart displays the conversions over time.
If you are interested in learning how to layer your data sources within Chartio, check out our Layers docs.
Customers Using Google Analytics as a Data Source
Rocketmiles uses Google Analytics and Chartio to look at their conversion rate by market, cohort, price, and hotel star rating which helps them identify ways to optimize their algorithm.
Since Google Analytics as a source can’t be joined with our own database, and we still want to track everything by acquisition source / medium, we decided early on to store the Google Analytics tracking data in our database with every stored user interaction. That proved to be extremely powerful, and allowed us to better understand our marketing attribution and therefore also how to spend effectively.
MongoHQ uses many different data stores, so they use Chartio as a front end to engage with their data stores.
We use a combination of SQL, NoSQL, and other services - MongoDB, Postgres, Redis, Reimann, Google Analytics, etc. We needed a platform that would allow us to visualize, experiment, and collaborate with our data.
When you have Google Analytics connected to Chartio along with your other data sources, that provides you with a single tool to look at your data. You can compare similar statistics from multiple sources or compare trends that are co-dependent (such as traffic and sign-ups).
For more information on connecting Google Analytics, check out our support docs and if you have any questions send us a note at hello@chartio.com.


