How Meteor Uses Segment Sources and Chartio to Drive Growth
Posted by on September 14, 2016 Chartio
Recently, Dan Ahmadi, Director of Growth at Meteor sat down with us in a webinar outlining how Meteor uses Segment Sources and Chartio to drive exponential growth that fuels their open-source projects.
Meteor is a company that focuses on building tools that simplifies application development for developers by providing an open-source Javascript framework written using Node.js. Meteor’s framework enables developers to build prototypes of their web and mobile applications.
Meteor’s projects collect a large volume of data ranging from Github activity, website traffic and Support ticket data. Because Meteor is an open-source community with 600,000 Javascript developers contributing lines of code to projects, it has created a dense data source. So, it’s crucial for Meteor to proactively and accurately analyze their data.
From Raw Data to Insights
During the webinar Dan walked us through how Meteor connects Segment Sources to Chartio to analyze their data from Meteor’s Apollo open-source project. In fact, the project has generated 2.4 million Segment events per week, or four events per second, since its release earlier this year.
At an hourly rate, Meteor is pushing their Segment Sources event data into their Amazon Redshift data warehouse. Once the data has been processed through Amazon Redshift, Meteor can then instantly access and analyze their data within Chartio.
In addition to Segment data, Meteor also generates data from a handful of other sources such as Google Analytics and Chart Mogul (for additional data sources, view the image below).
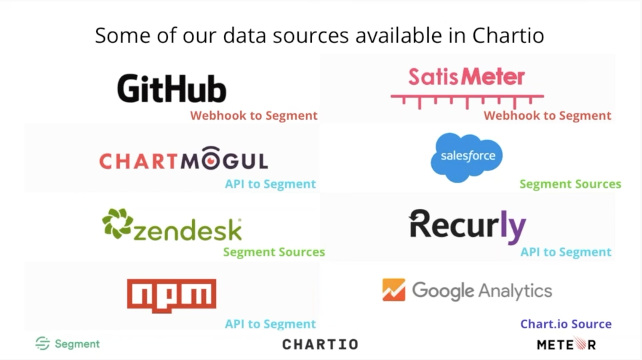
Meteor data sources available in Chartio
Mission: Apollo
In merging disparate data sources into one consolidated view, Meteor can track all the activity happening for their Apollo project. These disparate sources include GitHub data, Meteor’s Command Line Interface tool and website event data.
Since Apollo is an open-source project for developers, it makes sense that a lot of crucial data can be found within Meteor’s GitHub repository.
“Before Segment and Chartio, we were unable to pull a report directly from our GitHub data. If we wanted a report, we’d have the pull the data from GitHub and crunch the numbers manually. This raw data format doesn’t help us answer our questions,” said Dan Ahmadi.
Today, Meteor is able to use Segment and push their GitHub data into Amazon Redshift and then into Chartio to create insightful dashboards. Instead of a running log of who has contributed to the Apollo project, Meteor now has metrics and drill down capability.
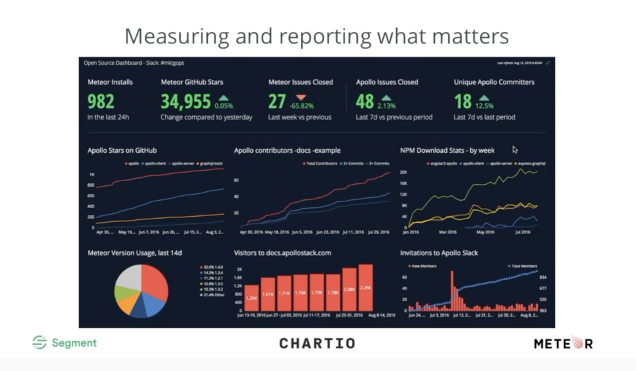
An example dashboard for Meteor’s Apollo project
To build the above dashboard, Meteor used Chartio’s intuitive Chart Creator. Even though the team can write SQL, the team preferred Chartio’s drag-and-drop, Interactive Mode, because they found it was easier to understand what was happening with their data and easier to view the inputs and outputs of each step.
Additionally, Meteor gravitated towards the Interactive Mode as a way to future-proof their dashboards so when someone looks at a table in the future, they know how the numbers were generated.
The Meteor team also uses Chartio’s Data Pipeline to transform raw data into a format that suits their needs, such as grouping and filtering data by number of contributions.
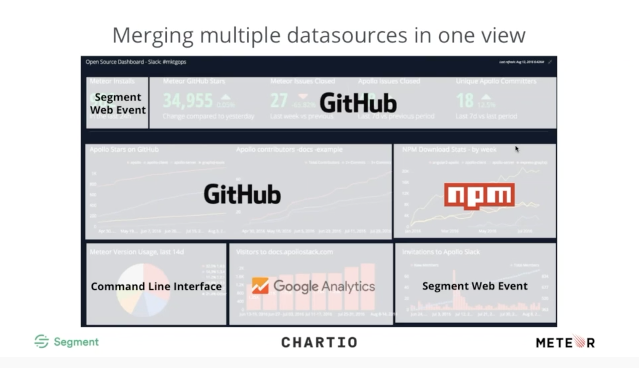
The data sources for each chart within the Apollo dashboard
In addition to charting growth based on contribution activity, Meteor uses the same data set for a completely different metric: new user acquisition. As an open-source project, Apollo acquires a number of new developers per day and incentivizes them to continue to contribute.
From their GitHub data, Meteor is able to track the number of newly acquired developers and have the Meteor community team reach out to the new contributors and send them a Meteor care package. Additionally, Meteor has a public Slack channel where they encourage their Apollo developers to signup and communicate with one another (bonus: the signup activity is yet another data source for Meteor).
Conclusion
By getting their data from Segment Sources into Chartio, Meteor is able to democratize data across the company. Today, Meteor displays relevant dashboards around the office on TV screens for the entire company to see.
“A major benefit in putting data in a public place is that people will walk by and ask questions. Our Engineering team can see what new trends have taken place overnight and it allows us to make strategic decisions based on data,” said Dan Ahmadi.
For an extended look at how Meteor uses Segment Sources and Chartio to drive exponential growth for the Apollo open-source project, watch our on-demand webinar with Dan Ahmadi and JJ Nguyen.
