How to Create the Ultimate Marketing Dashboard
Posted by on January 31, 2017 Dashboards, Data Analytics, Marketing, Marketing Analytics
In our latest webinar, How to Create the Ultimate Live Marketing Dashboard, we teamed up with Treasure Data to show how live data integration is critical to the success of businesses. However, many businesses—whether they’re a Fortune 500, have a large data team or are an emerging startup—struggle to access their data in real-time.
Why Live Data?
For many companies, data is housed in a different business applications and SaaS tools, which unfortunately means that each database wasn’t particularly designed to share data with one another. And with that, it becomes increasingly difficult for companies to access their data.
Historically, insights were rarely conducted in real-time. It’s always been in “relative real-time.” Meaning, there was a delay in getting your CRM data connected with your production database, etc. Data workflows varied but often worked like this:
Data Sources -> Wait for Engineering to connect the data -> Insights
But, those days are over. Treasure Data, a live data management platform, was created to alleviate this problem, ensuring that your business data is always connected, current and accessible.
Rather than struggling with siloed data, companies need to have access to all their data in real-time to remain competitive. Treasure Data connects with all the business applications that powers your company, such as: web data, streaming data from mobile, CRM databases, marketing automation, event tracking data and much more.
Data Simplified: Treasure Data and Chartio
For Marketing teams, tracking customers throughout the funnel is crucial to their success. Accordingly, the first step is the top of the funnel (TOFU), which in this example we’ll define as when a potential customer (prospect) fills out an email form. The typical data capture and sync workflow looks like this:
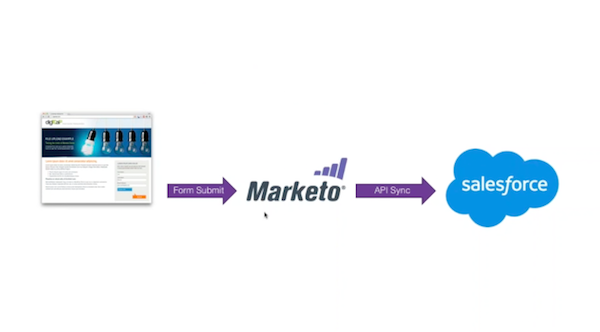
Though this is a standard flow for many marketers, it only provides one view into the customer. In the webinar, Glenn Davis, Product Marketing at Treasure Data stated that marketers historically wouldn’t be able to correlate any additional data to that flow. Further, marketers would have to look at this data and Page Views data from Google Analytics is separate views. However, with the power of Treasure Data and Chartio - marketers can now blend the two data sources and visualize their data.
With Treasure Data, marketers would be able to heavily enrich their data:
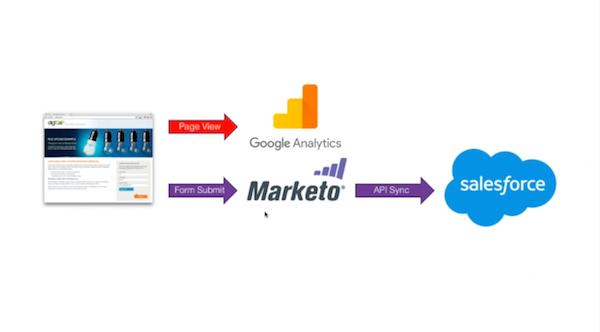
And then with the full combined power of Treasure Data and Chartio, we created a powerful Marketing dashboard to show how this data can be used to calculate KPIs.
Chartio in Action: Top of Funnel Leads
After understanding the value of how data should be connected, the webinar then moved into transforming the data into real-time insights by using Chartio.
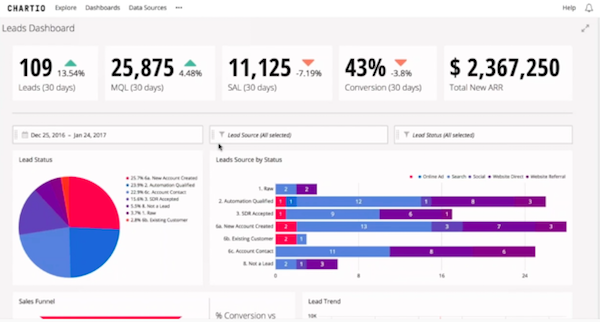
The above is a Marketing dashboard that features leads created, conversion rate, marketing attributed ARR and other various marketing metrics. During the webinar, Jennifer Hudiono, Customer Success Engineer at Chartio, walked us through step-by-step on how to create the Top of Funnel Leads single value chart.
As you can see from the dashboard, we’re tracking the total number of leads brought in over a current 30 day period in comparison to the past 30 day time frame.
To create the leads chart, drag and drop the following measure into our Interactive Mode:
- Measure: Count of distinct - Lead ID (this counts the number of leads)
In the filters section, you’ll want to narrow down the time frame by selecting “Lead Created Data” and set it to 30 days. Hit “Run Query” and you’ll get a single value chart with the appropriate amount of leads.
Then, to compare this number to the past 30 days, add another layer via our Data Pipeline and change the “Lead Crated Data” to 31. Merge the layers (see below) and hit “Run Query” again.
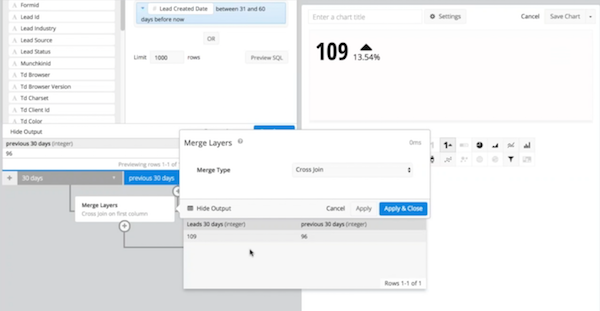
Chartio in action
Conclusion
For a complete tutorial on how to combine Treasure Data and Chartio to create the ultimate marketing dashboard, watch our on-demand webinar.


