Optimizing Your Content Using Google Analytics
Posted by on September 27, 2017 Data, Data Analytics
As companies are producing all types of content, it’s more important than ever to optimize your content based on relevancy and the customer experience. Content optimization is a critical step in not only content creation, but also a strong catalyst in moving prospects through the funnel.
There are a lot of ways to optimize content: switching up keywords, changing images, testing different titles and performing SEO best practices. While all of these aspects are a must in optimizing content, you can also optimize content by leveraging a platform you already have: Google Analytics.
While there’s no shortage in figuring out the right way to use Google Analytics, we recently teamed up with Charles Farina, Director of Growth & Development, at Analytics Pros and hosted a Video Stream to share advanced tips and tricks with Google Analytics.
With over ten years of experience exploring and mastering the platform, Charles has picked up several tips on how to optimize content through Google Analytics to create a better customer experience and improve your business.
In this blog post, we’ll share with you Charles’ top five advanced tips and tricks using Google Analytics, so you can optimize your site content.
Tip #1: Identify Your Most Valuable Users
Understanding how your most valuable users interact with your site and what their traits are is a crucial first step in optimizing your content. These most valuable users embody your ideal customer, they are likely to purchase often and in large amounts—so it makes sense that you want to understand them.
The first step in identifying your most valuable users is to segment your audience and grasp how their experiences differ from less engaged users. To segment your audience, head over to the User Explorer report in Google Analytics (as shown below):
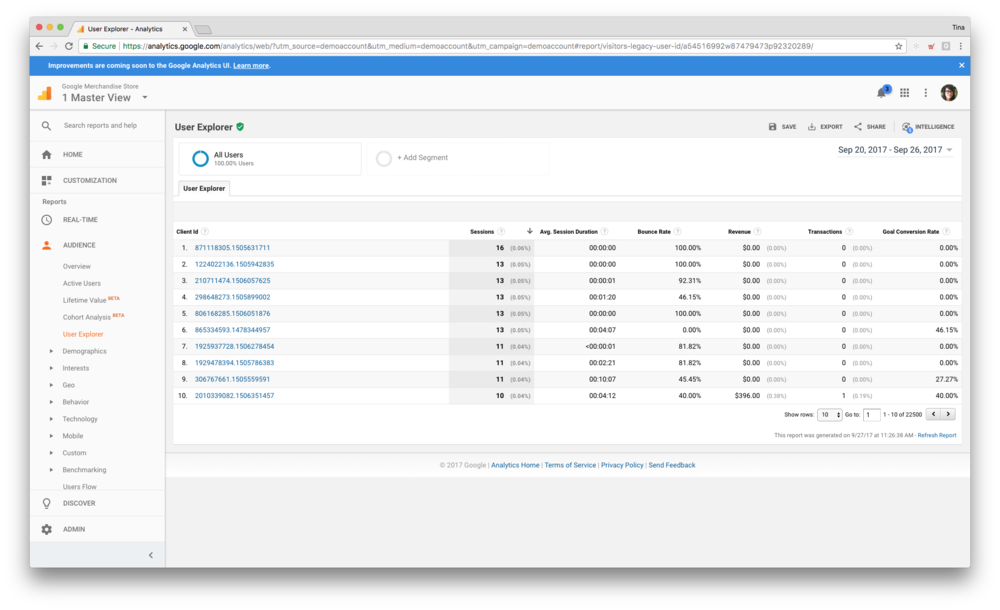
The User Explorer report allows you to identify specific users and understand each activity and event that takes place on your site. You can view each data point from the time a user first visits your site to each activity thereafter up to the current date.
In the video below, Charles shows us how to navigate through the User Explorer report to understand which content pieces your most valuable users resonated with and provides content pages that need optimization.
Tip #2: Create Your Own Bounce Rate Benchmark
While Google Analytics provides benchmark reports around Bounce Rate, Charles believes that these reports aren’t actionable for many companies. Since these Bounce Rate benchmarks are created across verticals and industries, Charles believes that companies should focus on their own bounce rate.
Charles recommends that companies use their own Bounce Rate as a proxy to make changes and a mechanism to find opportunities for content optimization throughout their site.
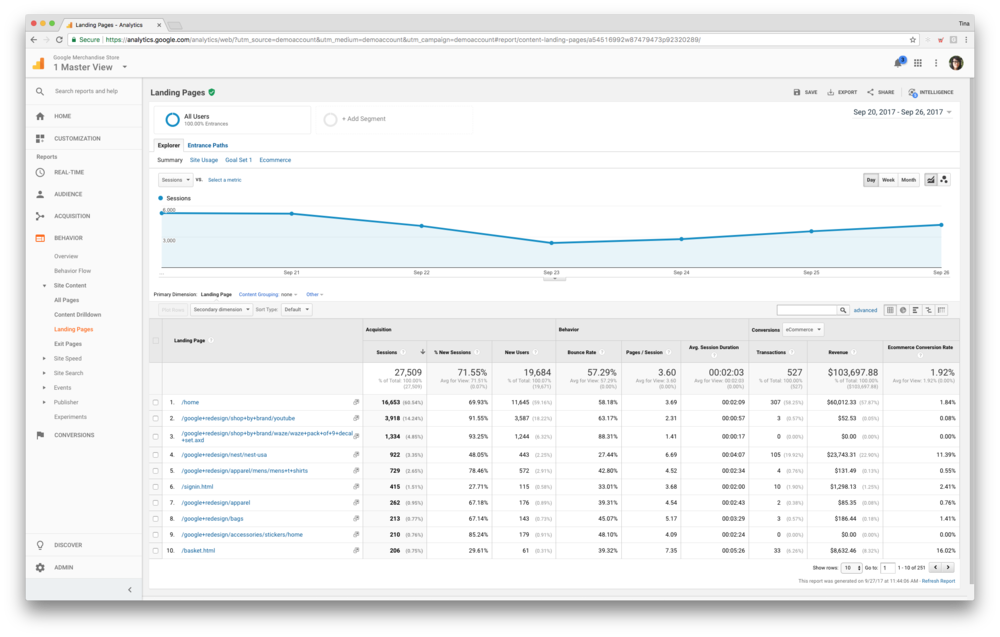
To understand what is a good bounce rate for your company, head over to the Behavior Report > Site Content > Landing Pages.
Note: The Bounce Rate is a number for a particular page, so depending on the type of content, there are times when a high Bounce Rate is ideal (i.e. a Support or Technical Documentation page - the user landed on the page, found what they needed and left).
In this video, Charles shows us how to segment out our own Bounce Rate to create an internal benchmark by using Google Analytics’ Comparison Feature. This hidden feature allows you to compare each individual page on your site versus your newly created internal benchmark, ultimately highlighting opportunities for optimizing content.
This hidden feature allows you to compare each individual page on your site versus your newly created internal benchmark, ultimately highlighting opportunities for optimizing content.
Tip #3: Optimize Homepage Content
Your company’s homepage is the first portal into your product and brand. For many companies, we spend a lot of time working to optimize the content on this page. While Charles believes that the homepage is the go-to place to navigate through a website, companies spend too much time optimizing this single page.
Instead, Charles suggest that companies optimize the content on their homepage in relation to every other page on their website.
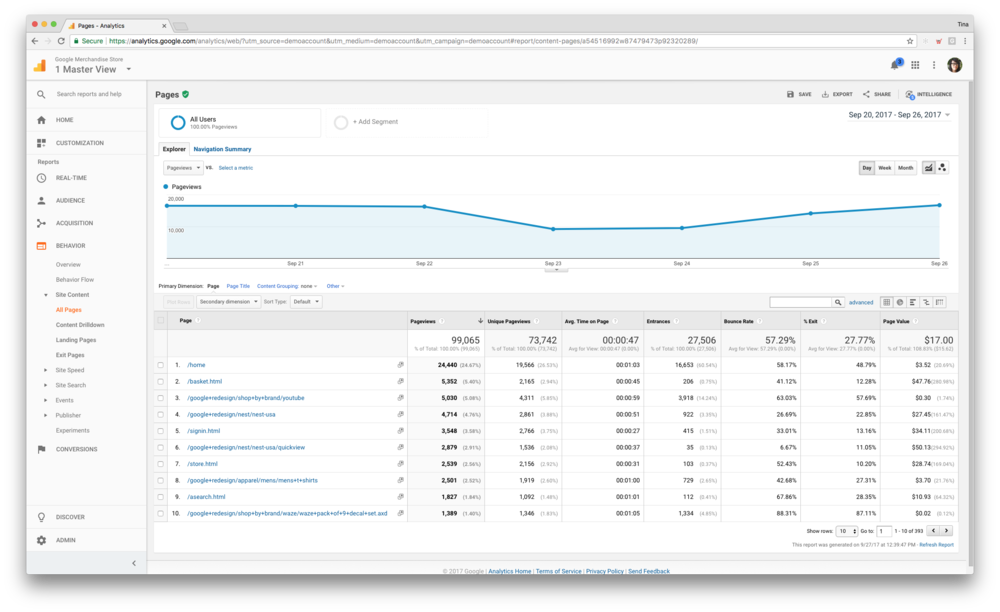
You can quickly pull this report by following these steps in Google Analytics:
- On the left hand side, click Behavior
- Then click the Site Content tab
- Click on All Pages to populate the report
- From this report you can see the view percentage of your homepage in relation to all the content on your site
This is a valuable report because companies tend to get wrapped up in running A/B tests and tweaking their homepage, but it’s important to remember to check its performance in relation to all other pages as well.
Tip #4: Using Advanced Segments to Determine Content Based Conversion Rates
A conversion takes place when a user on your site takes an action that converts them into a paying customer (or other goal like signing up for a trial, etc.). No matter how your company defines a conversion (purchase, filling out a form or completing a high number of activities on site), measuring which piece of content yields the highest conversion is a leading factor in optimizing your web content.
Follow along in this video as Charles shows us how to leverage Google Analytics’ Advanced Segments feature to understand which pieces of content are converting users to customers.
Tip #5: Using Google Analytics to Generate Content Ideas and Optimization
While many people see Google Analytics as a quantitative platform that shows singular values and numbers, as Charles points out, there are a few key ways that Google Analytics provides qualitative data as well.
Google Analytics shows qualitative data in two main ways: the Site Search Report and the Sessions Replays feature.
Site Search Report
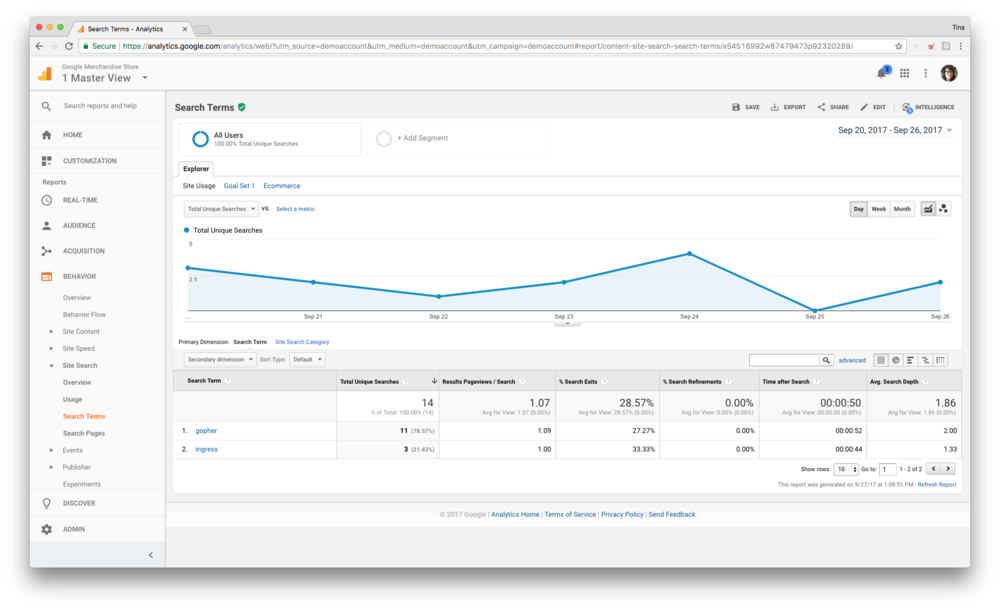
If your website has a search feature, you can leverage this data to your company’s advantage when it comes to optimizing content. Using this data provides a unique content opportunity as it’s a running list of what’s most important to your site visitors as they’re performing an on-site search.
This report is full of potential content ideas and so you can go through the list and search for terms that have a high exit percentage (users who perform a search and leave without looking at anything else on your site) and optimize the search results and on-page content.
Sessions Replays
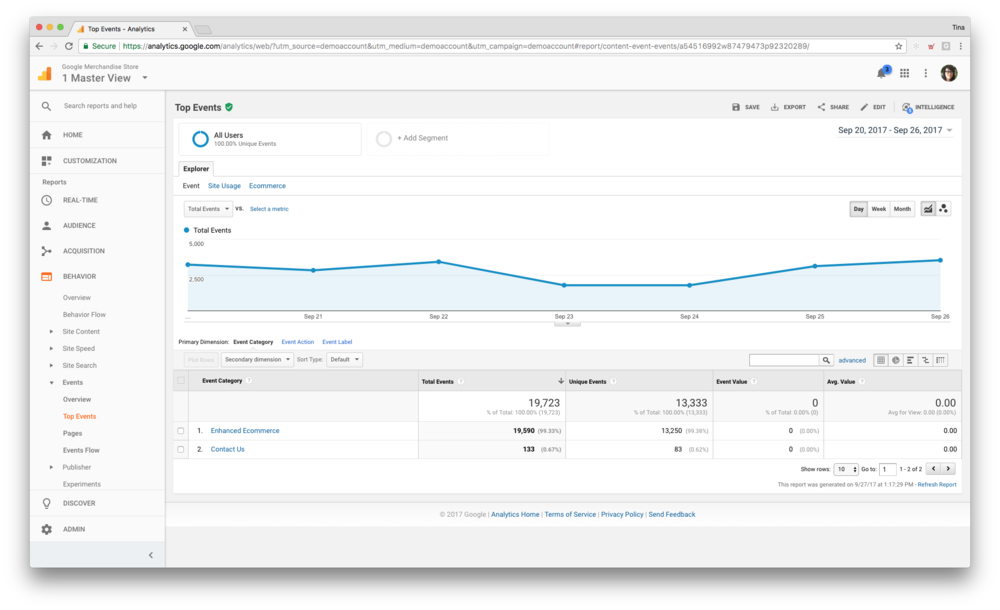
Another valuable way to get qualitative data from your Google Analytics is to perform event tracking on your site. By default, Google Analytics does this in the Top Events report (Behavior > Events > Top Events), but Charles takes this one step further by integrating Google Analytics data with a tool called SessionCam.
SessionCam is a tool that allows you to analyze customer interactions on your site by recording customer activity so companies can better understand behavior and optimize for conversions.
To read Charles’ full write up on SessionCam read his blog post, Session Recordings with Google Analytics.
Conclusion
Leveraging the power of Google Analytics and implementing these four advanced tips and tricks will allow you to optimize your content and quickly see results. Google Analytics is more than just a quantitative platform that provides insights on visitors, but should also be used as a platform that drive actions.
For more advanced Google Analytics insights from Charles, watch our full webinar Advanced Google Analytics Tips & Tricks with Analytics Pros.


