How to Track Your Sales Opportunities in a Dashboard
Posted by on September 12, 2017 Data Analytics, Sales, Dashboards
A dashboard that tracks your sales opportunities allows you to see where your prospects are in the sales pipeline. This dashboard is core to understanding and ultimately winning in sales. With Sales reps juggling discovery calls, their inbox and keeping track of their sales funnel—having a repository of sales opportunity engagement throughout the funnel is crucial. Much like how a dashboard is core to your business, a dashboard tracking your sales opportunities is integral to your Sales team.
Creating a dashboard that effectively tracks your sales opportunities requires combining data from multiple sources including Salesforce, Hubspot or Marketo and Google Analytics into a data visualization tool. While you can create sales opportunity reports in Salesforce, when that data is enriched with Marketing Automation and Google Analytics, it gets transformed into a full-view of your opportunities.
The Benefits Tracking Sales Opportunities
Understanding your sales pipeline is the most effective way to increase revenue and sales productivity because it enables Sales reps to stay focused and organized on their current opportunities.
In combining multiple sources of data (Salesforce for CRM, Marketo or Hubspot for Marketing Automation, Google Analytics for website activity and Intercom for in-app messaging and activity), you can get the full story on opportunities. There’s data about lead generation, outbound activities, emails, meetings, calls and buyer intent (knowing when a prospect is reading a case study or viewing the pricing page).
With all this information at a Sales rep’s fingertips, they’re more equipped to have fully informed and personalized conversations with prospects, no matter the stage of the opportunity.
Creating a Dashboard to Track Sales Opportunities
Creating a dashboard to track sales opportunities, while it does require more than just Salesforce or CRM data, is crucial in fully understanding prospects. In this section, we’ll unpack how to create a dashboard to track sales opportunities.
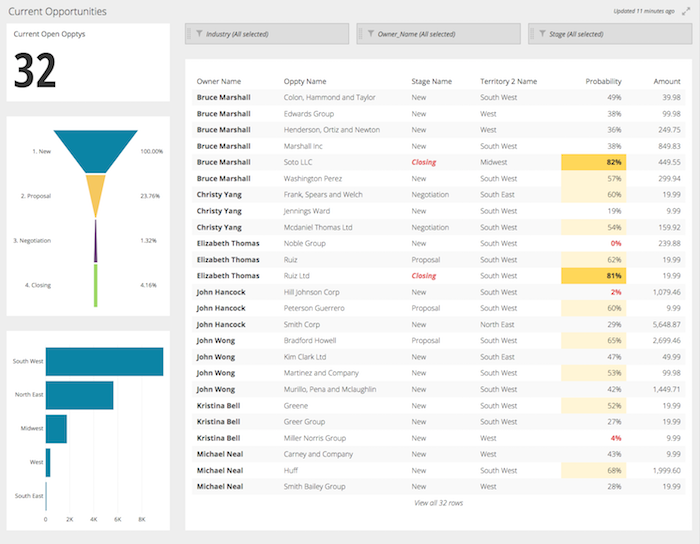
Here’s an example of a dashboard that tracks sales opportunities throughout the funnel:
To create this dashboard, follow these steps:
- Identify the metrics and KPIs you want to track in your sales opportunities dashboard
- Determine the appropriate data sources for these metrics (Salesforce, Hubspot or Marketo, Google Analytics)
- Connect your data sources to Chartio.
- From your organization homepage, click the + New Dashboard button to create a new dashboard in Chartio
- A modal will appear and direct you to name your new dashboard
- Click the Add Chart button on the right to create your first chart
- Use the Data Explorer to start building charts with our drag-and-drop mode, or you can use the SQL mode for each metric on your dashboard
- Once you’re done, save and share your dashboard with your organization via a scheduled report or shareable link with your organization
For our Sales Opportunities dashboard above, here are the metrics and their chart type:
- Current Open Opportunities (Single Value Chart): tracks the total number of current opportunities in your sales pipeline
- Sales Funnel (Funnel Chart): tracks the current stage of each opportunity within the sales funnel and calculates the conversion percentage following each stage
- Deal Size by Opportunity (Bar Chart): the deal size of each opportunity visualized based on the dollar amount
- Opportunities (Table Chart): A high-level view of opportunities, the owner (Sales rep), stage, dollar amount, etc.
From this dashboard, your Sales reps will be better equipped to have meaningful conversations with prospects and understand their sales pipeline with enriched data from multiple sources.
For more information on how to get full visibility into your sales pipeline, learn more about our Salesforce integration.


