Customers have been requesting the ability to export dashboards and charts as images and PDFs and to subscribe to a weekly update. We’ve slowly rolled out these features over the past few months and today we’re happy to announce them!
Exporting Charts
You can now download any chart as an image, PDF file, or even as a raw CSV (often used for Excel) file of the data used to render the chart.
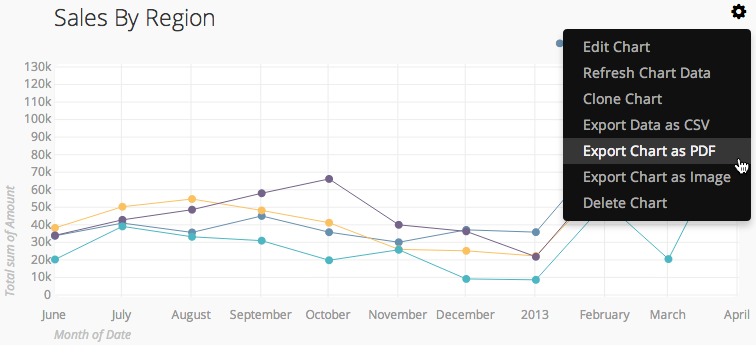
To export a chart click the settings icon that will appear in the upper right hand corner of the chart as you hover over it. A menu will apear with your export options. Clicking on one of those options will begin the download in your chosen format.
Exporting Dashboards
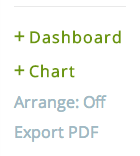
At the very bottom of your left hand dashboard sidebar you will now see a link to Export PDF. Clicking this link will begin a download of the very dashboard you’re viewing in PDF format. This makes it easier to print or email to the team.
Subscribing to Dashboards
Lastly, we’ve made it possible to subscribe to weekly PDF reports of what’s going on in your dashboards. To subscribe to a dashboard take the following steps:
- Visit your project settings and click Edit on the dashboard you’d like to subscribe to.
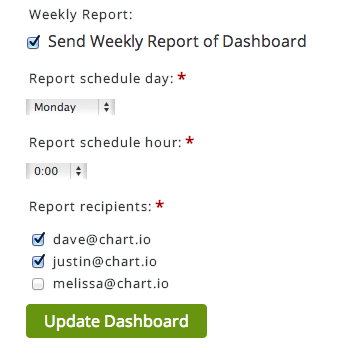
- At the bottom of the page enable Send Weekly Report of Dashboard
- You’ll then be able to select what day of the week and time you’ll want the report generated and emailed out.
- Choose which people on your team should receive the weekly report.
- Save your settings by clicking Update Dashboard
More information can be found in our documentation on Subscribing to Dashboards.


