Dashboards
A dashboard is a place for you to display a collection of charts. You can create an unlimited number of dashboards in Chartio and easily manage those dashboards from the landing page.

The dashboard layout allows you to quickly find what you need to create the most effective dashboard.
It’s good practice to create separate dashboards for different topics that you’d like to track. For example, you may have separate dashboards for Growth, Revenue, Inventory, Engagement, etc.
Landing page
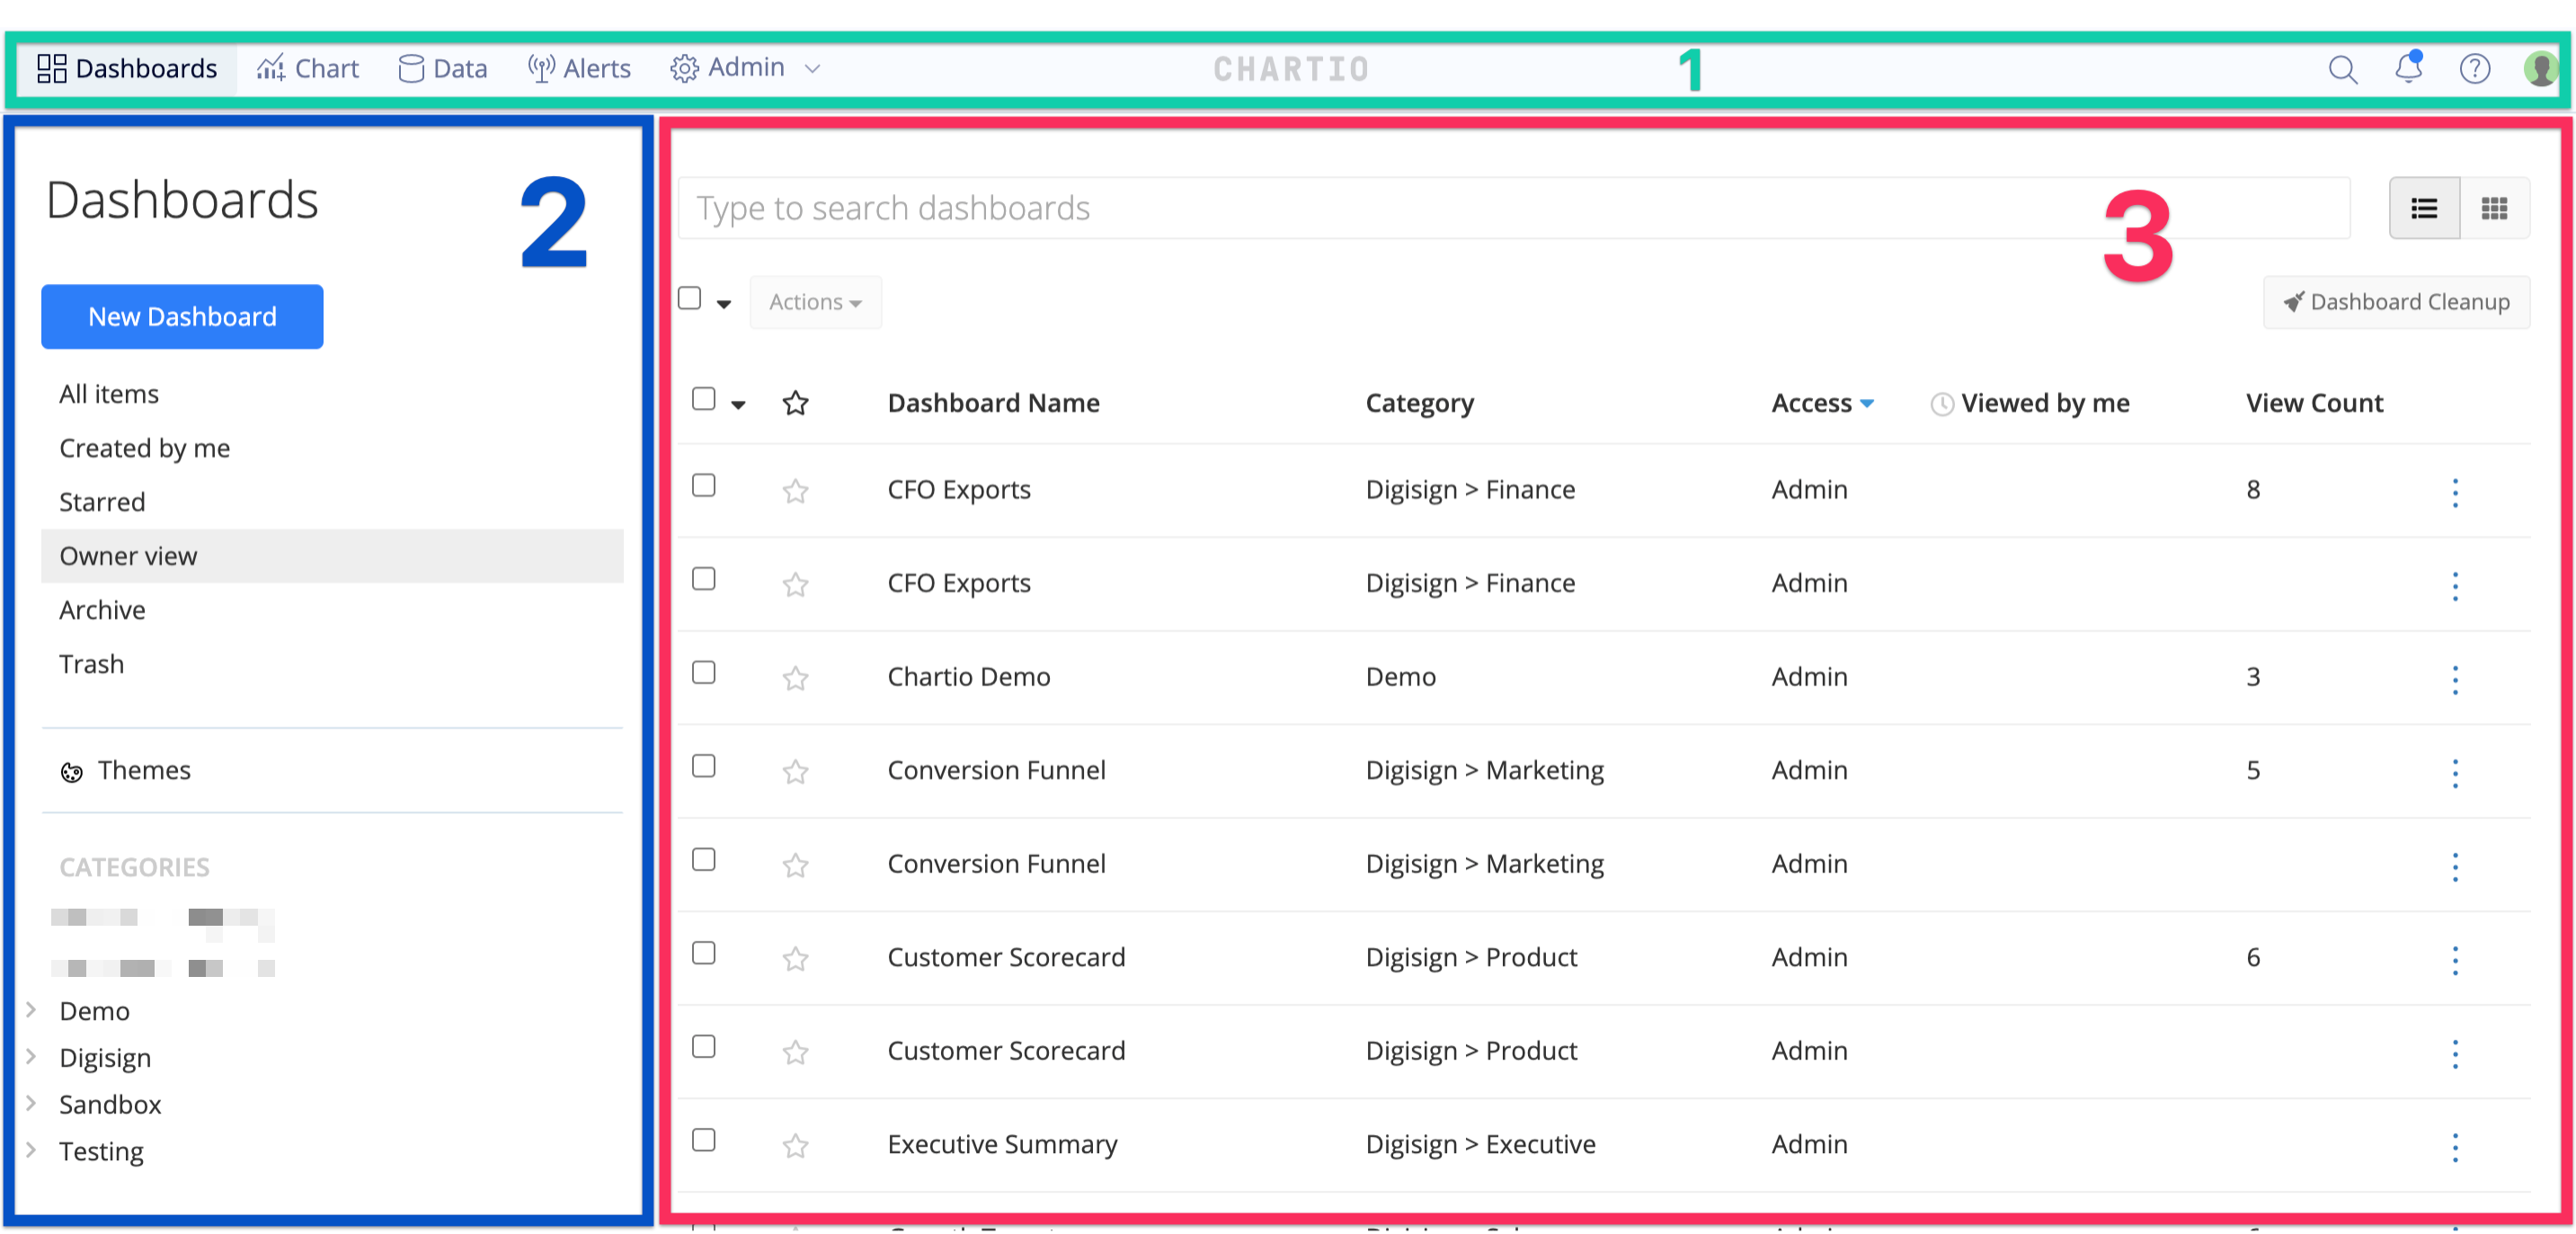
When you log in to Chartio, you’re directed to your organization’s landing page, where you can view all dashboards to which you have access within your organization. You can navigate back to this page by clicking Dashboards from the top navigation menu.

1) Top navigation menu
The navigation menu is accessible from any page within Chartio and includes the following features:
- Dashboards: This tab is where you can view all the dashboards you have access to and have created.
- Chart: Create quick ad-hoc queries using the Chart tab. You will be given the option to save your chart to a dashboard if you’d like.
- Data: The Data tab gives you access to all Data Sources and Data Stores to which you have access.
- Alerts: Available for Growth+ plans only; the Alerts tab allows you to view and manage all the Alerts created for your organization
- Admin: Open this menu to access your Organization settings, monitoring pages such as your organization Activity and Usage Stats, and other advanced features such as Slack Integrations and—if you’re on an Organization plan—Admin API and SAML authentication.
- Search Bar: Enter keywords into the search bar to search for charts, dashboards, and data sources. Click the result to open the dashboard, highlighted chart, or data source settings. The search results will only include dashboards and data sources to which you’ve been granted access.
- Notification Icon: Statuses on changes you’ve made such as data source schema refreshes and foreign key changes will appear here. Dashboard comment and chart comment notifications also appear here.
- Help: This extended menu offers various support resources such as our Documentation, webinars and working sessions, and Release Notes. You also have links to our Blog, Slack Community, and Data School.
- User Icon: Access and edit your personal profile or quickly switch to another organization to which you’re a member by clicking on this icon.
2) Landing page sidebar
From the landing page sidebar, you can:
- Create a new dashboard
- Filter the dashboards list with the predefined filter options
- All Items: View all dashboards in your organization that you have access to
- Created by me: View all dashboards you’ve created
- Starred: View all your favorited dashboards
- Owner view: Must be an owner to see this filter; view all your organization’s dashboards
- Archive: View all archived dashboards
- Trash: View all dashboards deleted in the last 30 days
- Access the Dashboard Themes
- View existing dashboard categories
3) Dashboards list
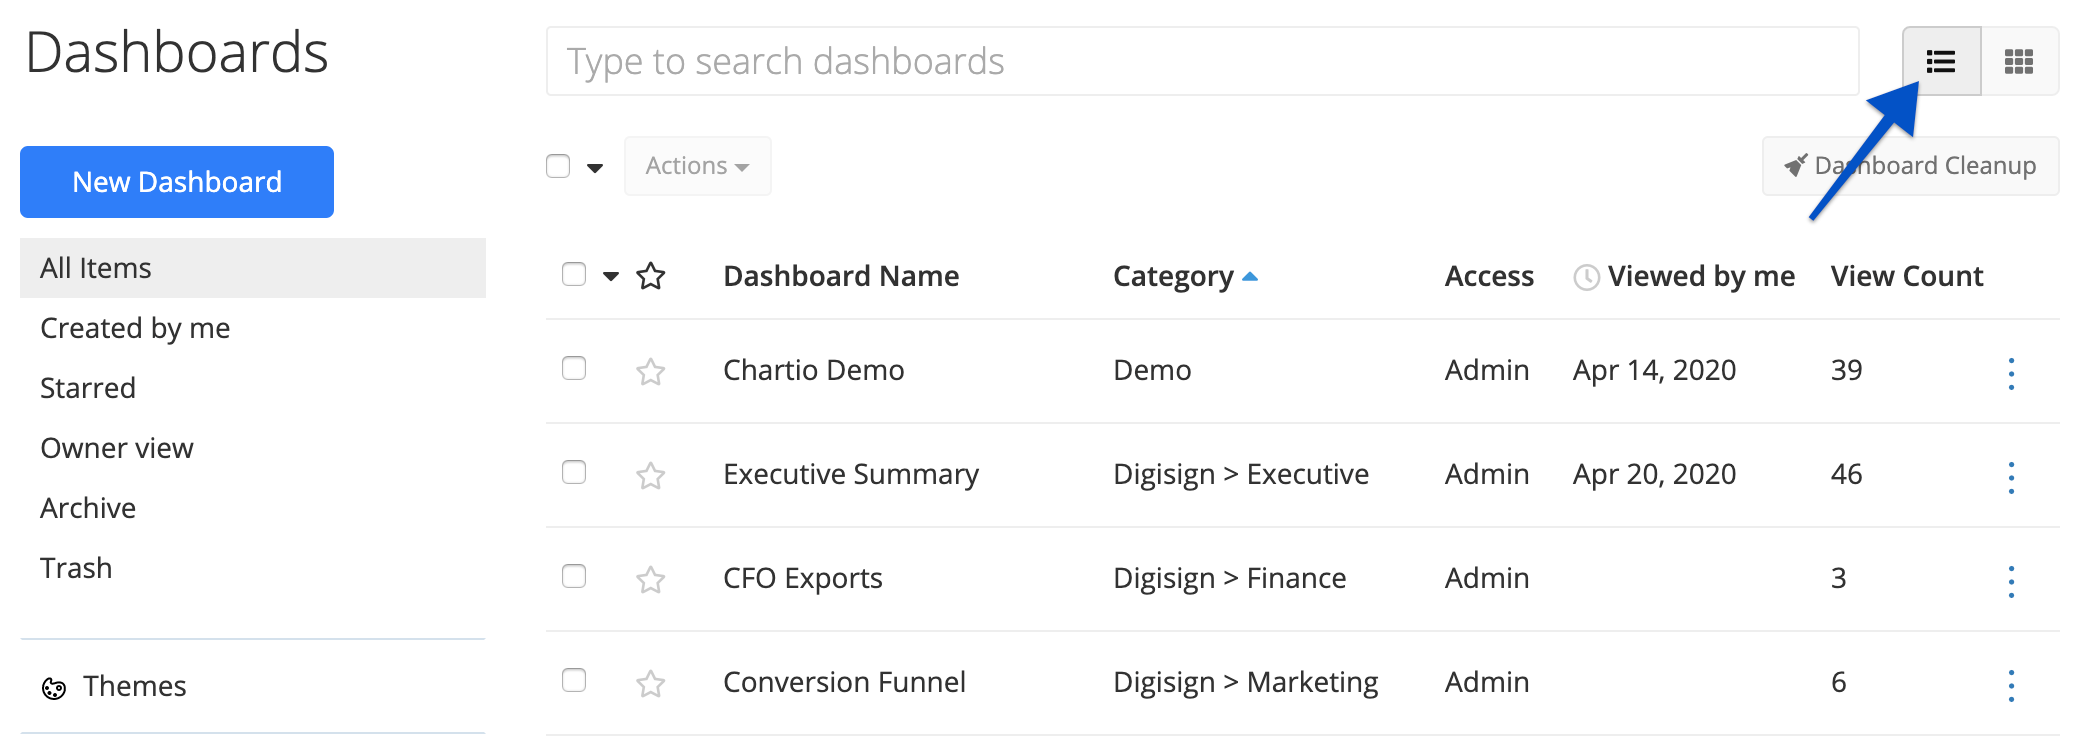
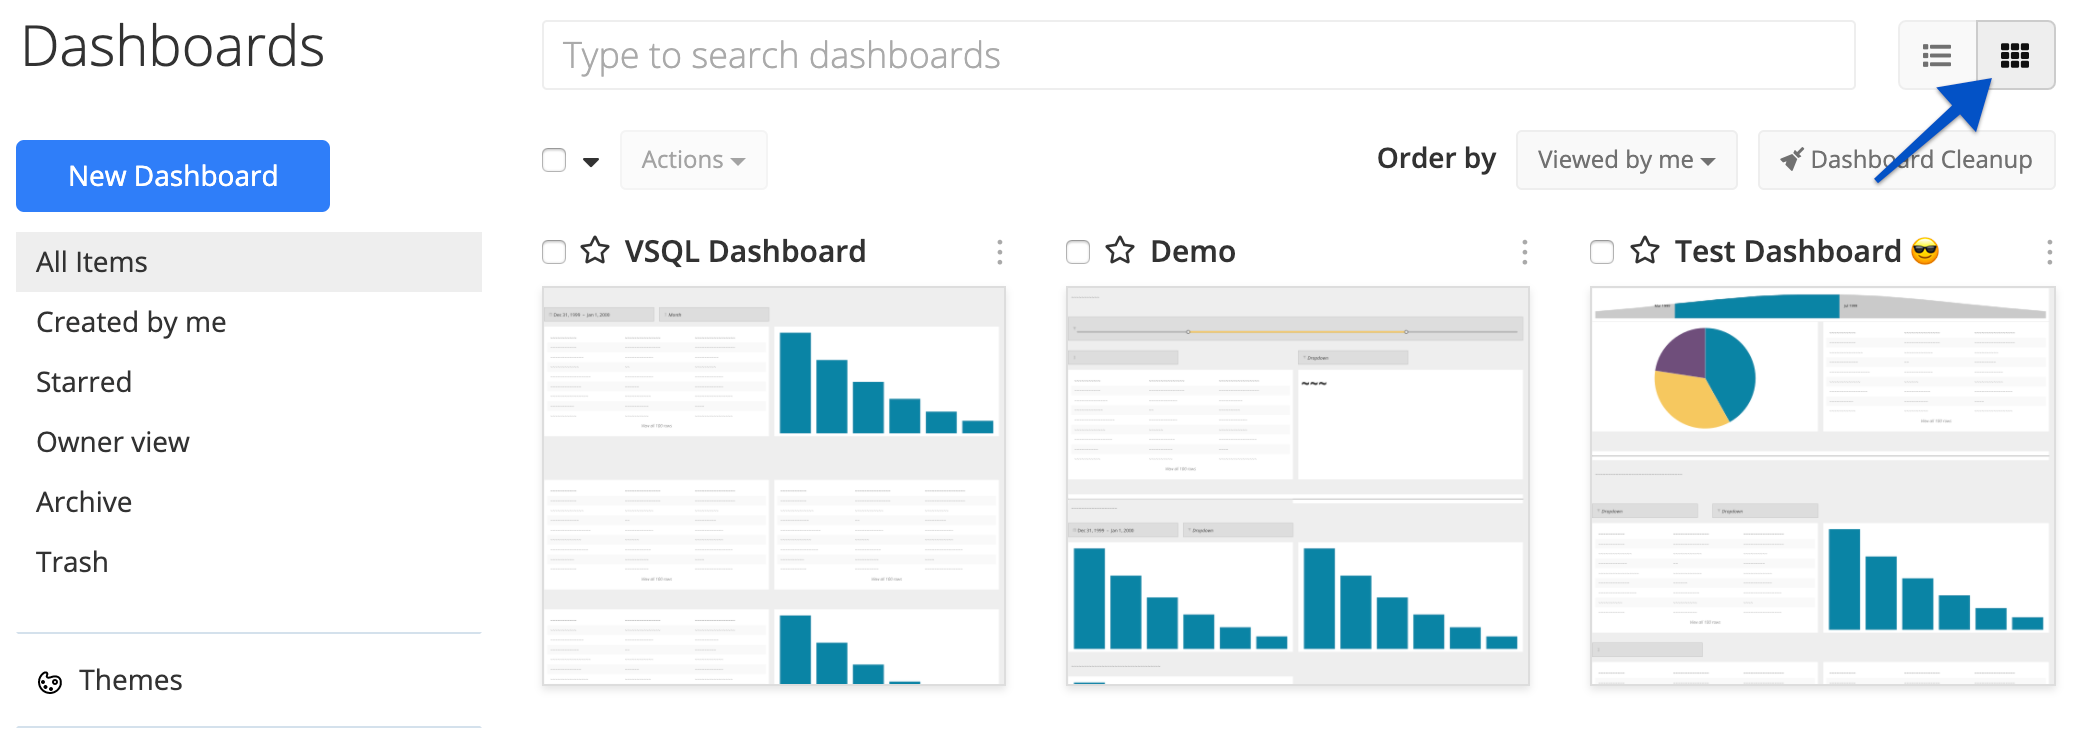
The dashboards list shows all dashboards for the current dashboards filter selection from the sidebar. You can change the view to either list view (default) or thumbnail view from the top-right corner. From either view, you can favorite a dashboard, multi-select dashboards to perform management actions in bulk, or access the Dashboard Cleanup feature.
List view
With the default list view, you get a compact list of the dashboards with additional information for each one:
- Dashboard Name: Name of the dashboard
- Category: Category the dashboard is in
- Access: Your access level for the dashboard
- Viewed by me: Last day you viewed the dashboard
- View Count: Number of views the dashboard’s received

Thumbnail view
With the thumbnail view, you get a thumbnail preview of each dashboard, giving you a sneak peak of the types of charts within it.
You can also sort the list by changing the Order by option beneath the view-selection buttons. By default, the sort is set to Viewed by me.

Dashboard layout
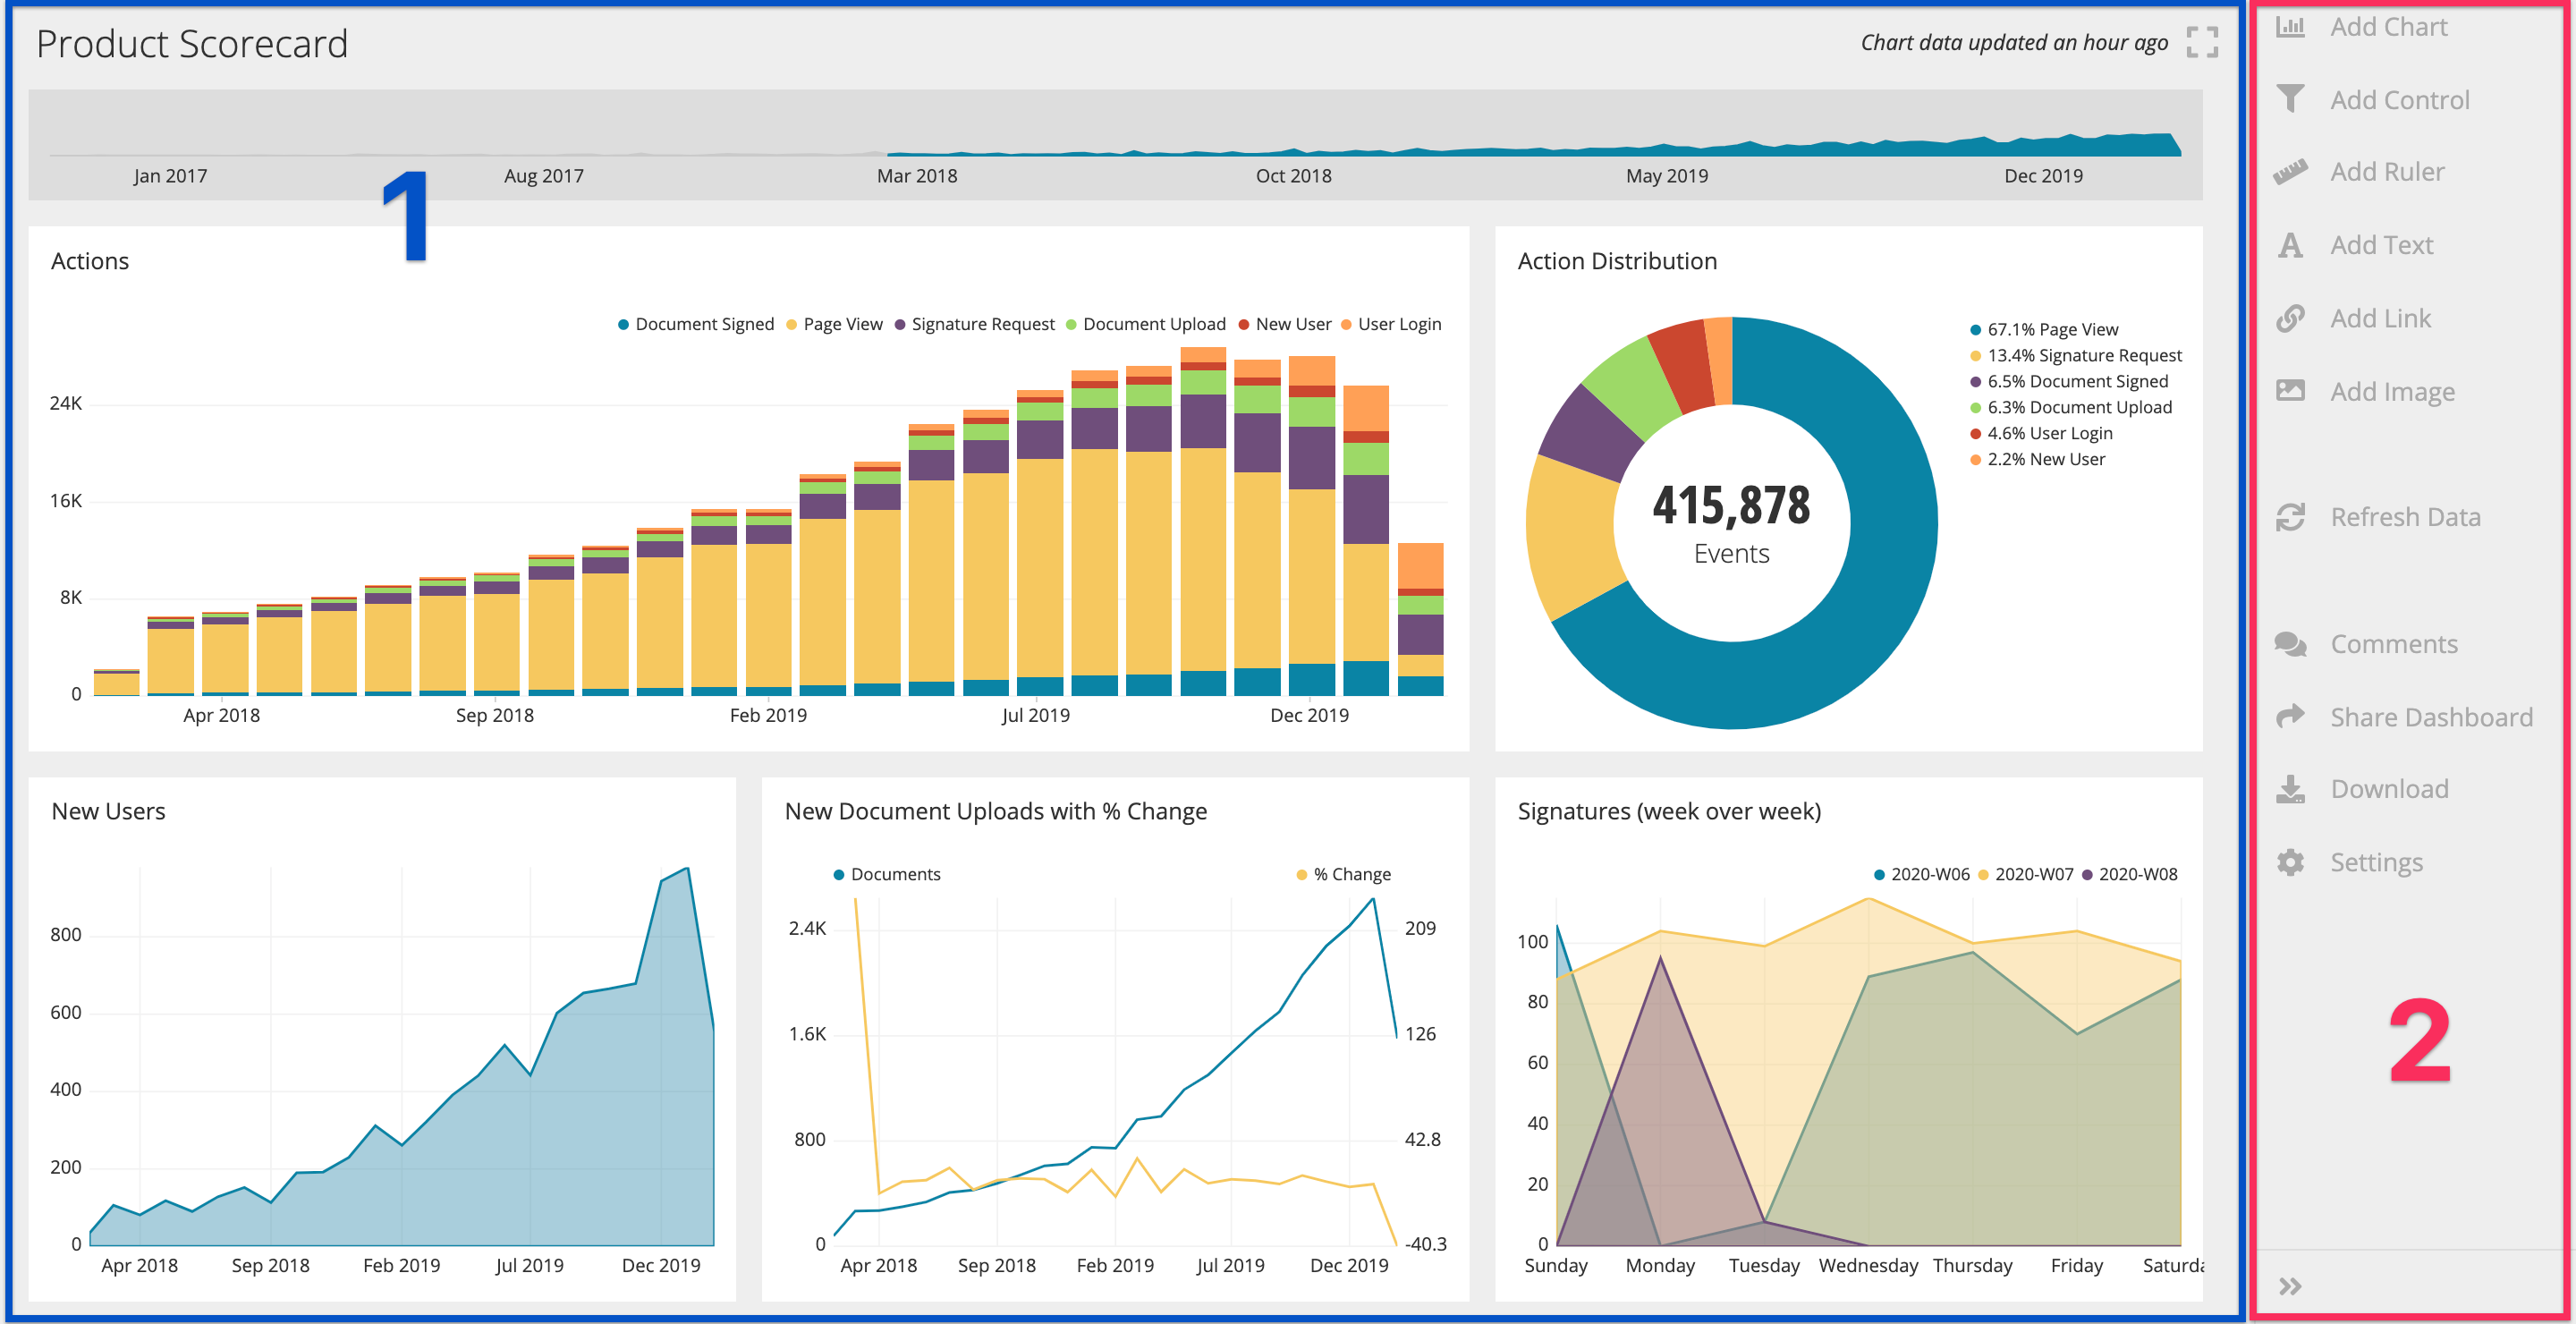
When you create a new dashboard, you’ll see the dashboard layout shown below.

1) Dashboard
The main dashboard includes all Charts, Controls, and Dashboard Elements. To edit any of the elements on a dashboard (chart, Control, ruler, etc.), hover over the item and click on the ellipsis menu on the top right corner. A menu will appear with the different editing and exporting options for this element.
Note: Editor or Admin access to the dashboard is needed to edit any of the dashboard elements. A limited chart menu will appear for those with Viewer access.
The dashboard also includes:
- Dashboard Title: Clicking the dashboard’s title will reset your Dashboard Controls to the default values. You can edit a dashboard’s title under the Settings tab.
-
Data Last Updated: The top right corner of the dashboard features a message with the time since the dashboard’s charts were last updated.
Note: Data Last Updated shows the last refresh time of the chart with the oldest cache.
- Full Screen: Clicking on the icon beside the last updated message will switch your dashboard view to full screen.
2) Dashboard sidebar
The right sidebar includes the Dashboard Elements, Settings, and the Menu View button. You can also click Download to download either a PDF or CSV of the dashboard.